
-7.68% for Gala — technical signals reinforce downside as volatility persists

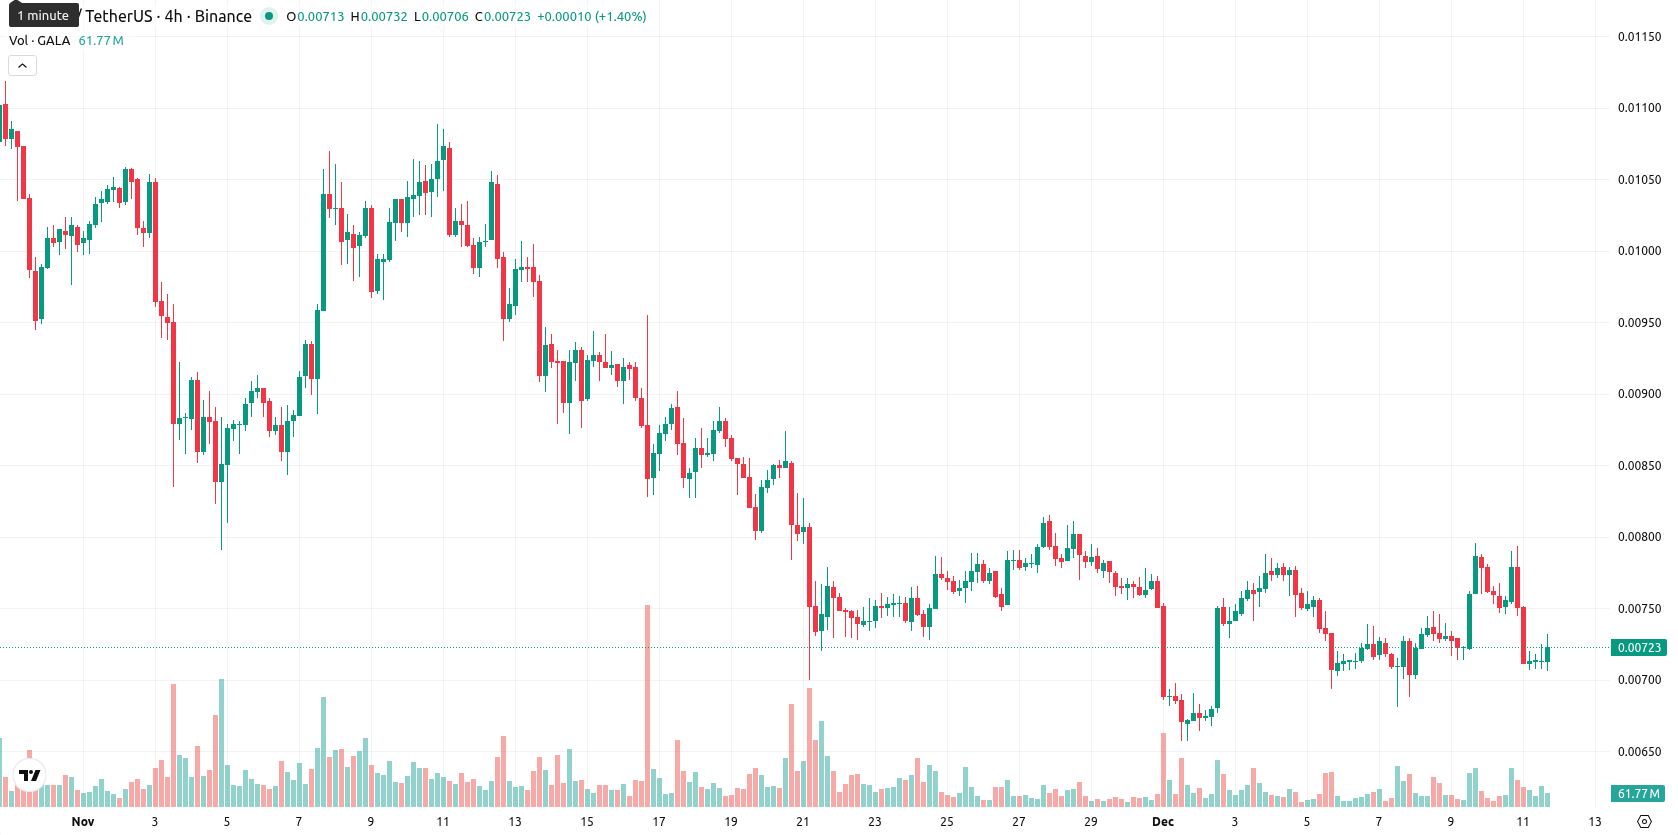
Gala (GALA) is currently trading at $0.00721, placing it below the MA-20 ($0.007507), MA-50 ($0.008890), and MA-200 ($0.014150), indicating seller pressure across short, medium, and long-term trends.
 0.002042
0.00222700
0.002042
0.00222700
Highlights
- GALA trades at $0.00721, remaining below the MA-20 ($0.007507), MA-50 ($0.008890), and MA-200 ($0.014150), reflecting persistent seller dominance across all timeframes.
- Price declined 7.68% today with high intraday volatility, currently hovering near daily lows and dynamic resistance at the Ichimoku Kijun level of $0.00806.
- Technical indicators are broadly bearish with a projected five-day range of $0.00650 to $0.00770 and less than 20% probability of a price increase.
Bearish momentum persists as intraday volatility shows mixed signals
The nearest dynamic resistance is around the Ichimoku Kijun level at $0.00806, while support sits near today’s low. Momentum signals are predominantly bearish on the daily chart: MACD shows a strong sell and ADX registers strong trend strength, while the RSI leans negative but is not oversold. The Stochastic RSI is overbought, and the CCI reads neutral, revealing mixed signals and possible short-term fatigue despite overall bearish momentum. The Bull/Bear Power indicator suggests buyers are still present intraday, even as price trades near the daily low within a relatively narrow range and high intraday volatility — reflecting sustained pressure after the open.
Consolidation likely as bullish breakout faces low probability
For the next five days, the adjusted expected range is $0.00650 to $0.00770, representing the typical volatility band relative to current levels. There is a very low probability (less than 20%) of a price increase, so further downside is more likely. The baseline scenario is for price consolidation within a lateral corridor near current levels, while a bullish scenario would require a convincing break above $0.00806 resistance; a bearish case could see a decline toward the $0.00700 area or lower if support fails.
Last time, analysts noted GALA was trading above its MA-20 but remained below the MA-50 and MA-200, reflecting short-term recovery momentum amid continued medium- and long-term pressure. Mixed signals from momentum indicators, including a bearish MACD, non-oversold RSI and CCI, and overbought Stoch RSI, suggested potential persistent upward strength even as volatility surged and the probability of further upside stayed low.









-
 Afghanistan
-
 Albania
-
 Algeria
-
 Angola
-
 Argentina
-
 Armenia
-
 Australia
-
 Austria
-
 Azerbaijan
-
 Bahamas
-
 Bahrain
-
 Bangladesh
-
 Belarus
-
 Belgium
-
 Bolivia
-
 Botswana
-
 Brazil
-
 Brunei
-
 Bulgaria
-
 Cambodia
-
 Cameroon
-
 Canada
-
 Chile
Chile
-
 China
China
-
 Colombia
-
 Congo
Congo
-
 Costa Rica
-
 Cote d'Ivoire
-
 Croatia
-
 Cuba
Cuba
-
 Cyprus
-
 Czechia
-
 DR Congo
-
 Denmark
-
 Dominican Republic
-
 Ecuador
-
 Egypt
Egypt
-
 El Salvador
-
 Estonia
-
 Eswatini
-
 Ethiopia
-
 Finland
-
 France
-
 Georgia
-
 Germany
-
 Ghana
Ghana
-
 Greece
-
 Haiti
Haiti
-
 Hong Kong
-
 Hungary
-
 India
India
-
 Indonesia
-
 Iran, Islamic republic
-
 Iraq
Iraq
-
 Ireland
-
 Israel
-
 Italy
Italy
-
 Jamaica
-
 Japan
Japan
-
 Jordan
-
 Kazakhstan
-
 Kenya
Kenya
-
 Korea
Korea
-
 Kuwait
-
 Kyrgyzstan
-
 Laos
Laos
-
 Latvia
-
 Lebanon
-
 Lesotho
-
 Libya
Libya
-
 Lithuania
-
 Luxembourg
-
 Madagascar
-
 Malaysia
-
 Malta
Malta
-
 Mauritius
-
 Mexico
-
 Moldova
-
 Mongolia
-
 Montenegro
-
 Morocco
-
 Mozambique
-
 Myanmar
-
 Namibia
-
 Nepal
Nepal
-
 Netherlands
-
 New Zealand
-
 Nigeria
-
 North Macedonia
-
 Norway
-
 Oman
Oman
-
 Pakistan
-
 Palestine
-
 Panama
-
 Papua New Guinea
-
 Paraguay
-
 Peru
Peru
-
 Philippines
-
 Poland
-
 Portugal
-
 Puerto Rico
-
 Qatar
Qatar
-
 Reunion
-
 Romania
-
 Rwanda
-
 Saudi Arabia
-
 Serbia
-
 Singapore
-
 Slovakia
-
 Slovenia
-
 Somalia
-
 South Africa
-
 Spain
Spain
-
 Sri Lanka
-
 Sweden
-
 Switzerland
-
 Syria
Syria
-
 Taiwan
-
 Tajikistan
-
 Tanzania
-
 Thailand
-
 Trinidad and Tobago
-
 Tunisia
-
 Turkey
-
 UAE
UAE
-
 Uganda
-
 Ukraine
-
 United Kingdom
-
United States
-
 Uruguay
-
 Uzbekistan
-
 Venezuela
-
 Vietnam
-
 Yemen
Yemen
-
 Zambia
-
 Zimbabwe
- Forex
- Crypto












