
Theta latest news: Technical signals mixed for THETA/USD despite price holding near session highs

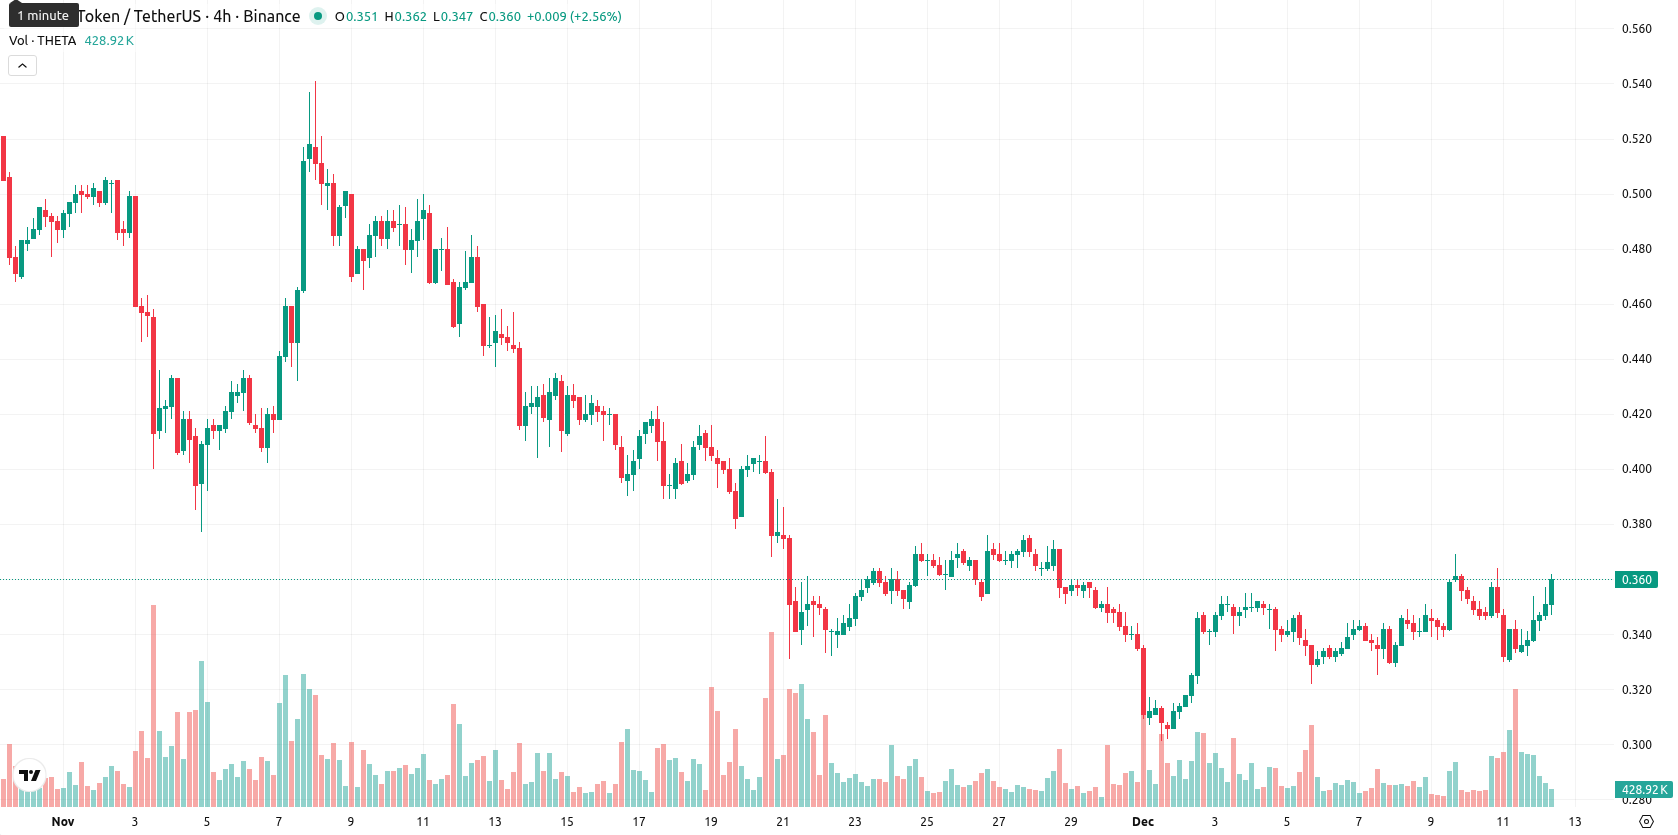
Theta (THETA/USD) is trading at $0.36, currently above its 20-day moving average ($0.3479) but still well below the 50-day ($0.41792) and 200-day ($0.67424) levels. This alignment highlights some short-term positive momentum while the medium- and long-term trend remains under seller pressure, with the Ichimoku Kijun near $0.362 acting as immediate resistance and support forming around the 20-day average.
Highlights
- Theta is trading at $0.36, above its 20-day moving average ($0.3479) but remains below the 50-day ($0.41792) and 200-day ($0.67424) averages, signaling ongoing medium- and long-term bearish pressure.
- Daily momentum indicators (ADX and MACD) remain bearish despite a 7.14% price rally and intraday buyer dominance, while overbought oscillator readings suggest caution for continued upside.
- For the next five trading days, Theta is likely to range between $0.33 and $0.37 with less than 20% probability of a sustained breakout above $0.37 due to persistent bearish weekly signals.
Bearish momentum persists as oscillators flag overbought risk
Momentum indicators present mixed signals: ADX and MACD on the daily chart are skewed bearish, pointing to continued downward pressure despite the current session's rally. RSI is at 41.97, showing a mild negative bias, while Stochastic RSI is overbought and CCI is neutral, signaling short-term buying enthusiasm but no clear reversal yet. Bull/Bear Power shows intraday buyer dominance, and the price is near today's high in a moderately volatile session, suggesting persistent strength at the upper end of the recent range. Overall, the divergence between bearish momentum and short-term overbought oscillators advises caution as the technical tone is not fully aligned with underlying trends.
Sideways range likely as negative signals cap breakout odds
In the next five trading days, Theta is expected to stay within a $0.33 to $0.37 band, reflecting typical volatility around current levels. The probability of a sustained move above this range is low (below 20%), given the persistent negative signals from weekly indicators such as the 50-day moving average, RSI, MACD, and ADX. Sideways movement within this band is the base case scenario as momentum and oscillator signals compete for direction. A close above $0.37 would signal a bullish breakout, while slipping under $0.33 could accelerate losses, especially if intraday strength gives way and the broader bearish trend reasserts itself.
Previously it was reported that Theta was trading just above its short-term moving average but remained well below key medium- and long-term averages, indicating developing support amid broader bearish momentum—RSI signaled a bearish bias, while MACD and ADX highlighted ongoing seller control. Strong volatility and mixed oscillators suggest caution as the price approaches immediate resistance, with high volatility and positive tone dominate highlighted in a strong 7.08% advance and consolidation likely within a narrow range barring a breakout above resistance levels.


-
 Afghanistan
-
 Albania
-
 Algeria
-
 Angola
-
 Argentina
-
 Armenia
-
 Australia
-
 Austria
-
 Azerbaijan
-
 Bahamas
-
 Bahrain
-
 Bangladesh
-
 Belarus
-
 Belgium
-
 Bolivia
-
 Botswana
-
 Brazil
-
 Brunei
-
 Bulgaria
-
 Cambodia
-
 Cameroon
-
 Canada
-
 Chile
Chile
-
 China
China
-
 Colombia
-
 Congo
Congo
-
 Costa Rica
-
 Cote d'Ivoire
-
 Croatia
-
 Cuba
Cuba
-
 Cyprus
-
 Czechia
-
 DR Congo
-
 Denmark
-
 Dominican Republic
-
 Ecuador
-
 Egypt
Egypt
-
 El Salvador
-
 Estonia
-
 Eswatini
-
 Ethiopia
-
 Finland
-
 France
-
 Georgia
-
 Germany
-
 Ghana
Ghana
-
 Greece
-
 Haiti
Haiti
-
 Hong Kong
-
 Hungary
-
 India
India
-
 Indonesia
-
 Iran, Islamic republic
-
 Iraq
Iraq
-
 Ireland
-
 Israel
-
 Italy
Italy
-
 Jamaica
-
 Japan
Japan
-
 Jordan
-
 Kazakhstan
-
 Kenya
Kenya
-
 Korea
Korea
-
 Kuwait
-
 Kyrgyzstan
-
 Laos
Laos
-
 Latvia
-
 Lebanon
-
 Lesotho
-
 Libya
Libya
-
 Lithuania
-
 Luxembourg
-
 Madagascar
-
 Malaysia
-
 Malta
Malta
-
 Mauritius
-
 Mexico
-
 Moldova
-
 Mongolia
-
 Montenegro
-
 Morocco
-
 Mozambique
-
 Myanmar
-
 Namibia
-
 Nepal
Nepal
-
 Netherlands
-
 New Zealand
-
 Nigeria
-
 North Macedonia
-
 Norway
-
 Oman
Oman
-
 Pakistan
-
 Palestine
-
 Panama
-
 Papua New Guinea
-
 Paraguay
-
 Peru
Peru
-
 Philippines
-
 Poland
-
 Portugal
-
 Puerto Rico
-
 Qatar
Qatar
-
 Reunion
-
 Romania
-
 Rwanda
-
 Saudi Arabia
-
 Serbia
-
 Singapore
-
 Slovakia
-
 Slovenia
-
 Somalia
-
 South Africa
-
 Spain
Spain
-
 Sri Lanka
-
 Sweden
-
 Switzerland
-
 Syria
Syria
-
 Taiwan
-
 Tajikistan
-
 Tanzania
-
 Thailand
-
 Trinidad and Tobago
-
 Tunisia
-
 Turkey
-
 UAE
UAE
-
 Uganda
-
 Ukraine
-
 United Kingdom
-
United States
-
 Uruguay
-
 Uzbekistan
-
 Venezuela
-
 Vietnam
-
 Yemen
Yemen
-
 Zambia
-
 Zimbabwe
- Forex
- Crypto
