
+7.82% for Bonk — low probability of sustained rally as resistance holds

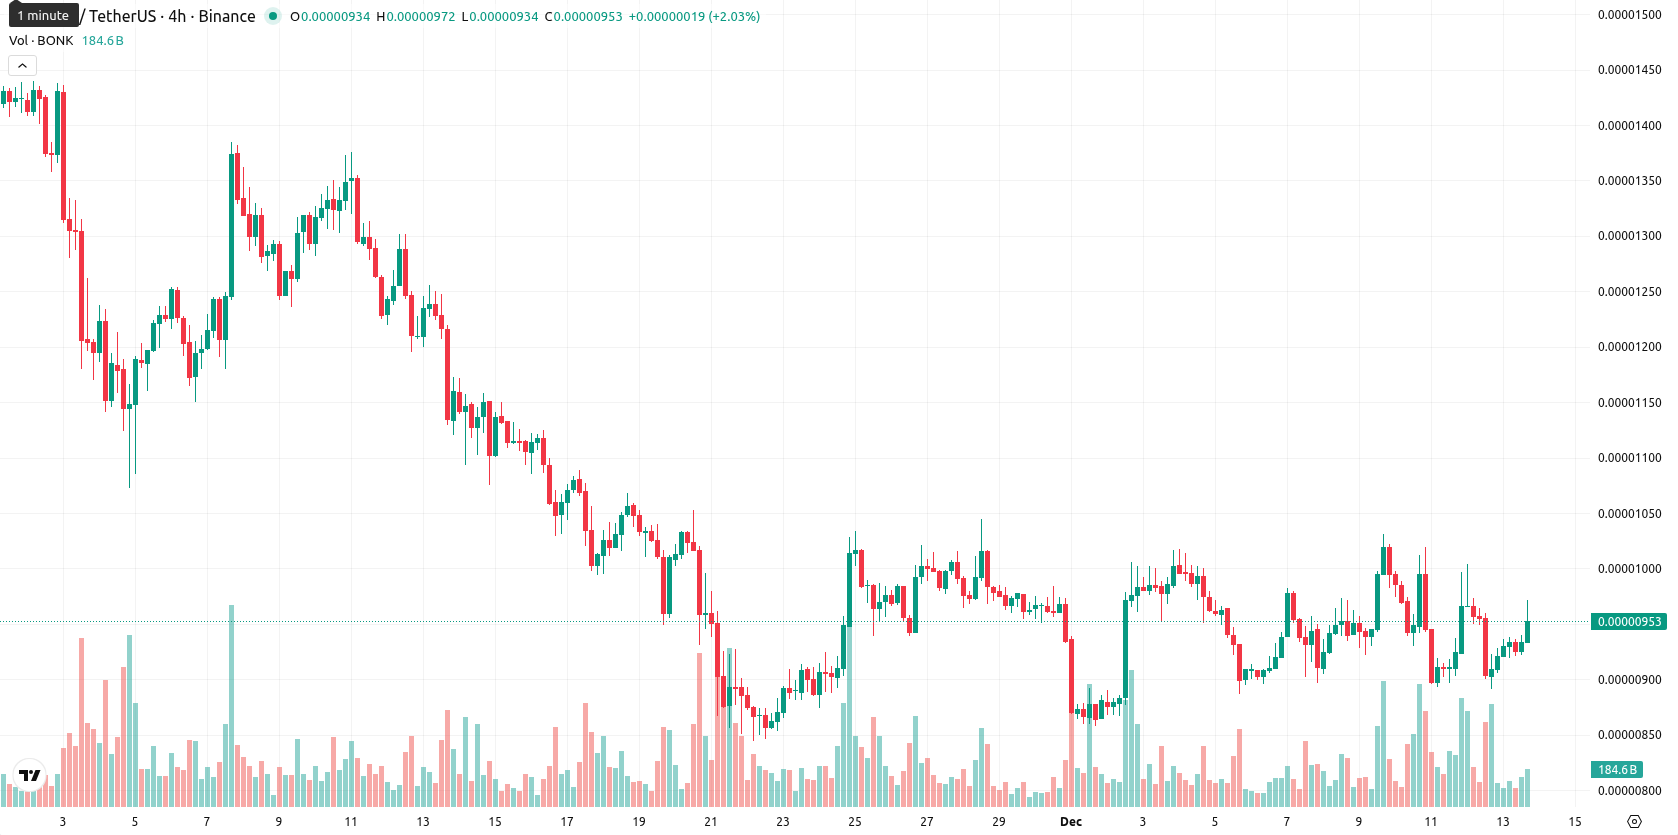
Bonk (BONK) is trading at $0.0000097, showing a 7.82% daily gain. The price has moved slightly above the MA-20 of $0.00000956 but remains well below both the MA-50 at $0.00001125 and MA-200 at $0.00001871, signaling weak momentum and persistent downside pressure against all key moving averages.
Highlights
- BONK trades at 0.0000097, a 7.82% daily gain, but remains well below MA-50 (0.00001125) and MA-200 (0.00001871), signaling persistent downside pressure.
- Daily MACD, ADX (34.3), and Stochastic RSI all deliver strong sell signals, while RSI sits subdued at 42.5 and CCI remains neutral just below zero.
- Range for the next five trading days is projected at 0.0000092 to 0.0000102, with a less than 20% probability of sustained price increase and sideways movement the baseline scenario.
Bearish momentum sustains as resistance clusters cap upside
Dynamic resistance emerges near the Ichimoku Kijun level at $0.00000967, almost equaling the current price, while the MA-50 acts as the next resistance band; neither golden nor death cross signals are present. Momentum indicators display a negative bias: the daily MACD shows a strong sell, the D1 ADX confirms a bearish trend with a reading of 34.3, and Stochastic RSI signals strong sell. RSI is subdued at 42.5, CCI is neutral just below zero, while BBP reflects some buyer dominance in today's session and the Awesome Oscillator stays neutral, failing to confirm the up move. Intraday price action sits near the session highs, reflecting elevated volatility, but ongoing bearish momentum prevails on higher timeframes.
Sideways bias remains as sustained rallies face technical headwinds
In the near term, price action for Bonk is expected to stay within a typical volatility band between $0.0000092 and $0.0000102, with the current price hovering near the midpoint. There is a low probability (less than 20%) for a sustained rally, with further declines more likely given universal weekly sell signals from key technical indicators. The baseline projection calls for more sideways movement within this corridor. A decisive move above $0.0000102 could catalyze a rapid test of the next resistance, but if support at $0.0000092 fails, sellers may drive prices toward previous lows.
Previously it was reported that Bonk maintained a bearish technical posture, trading below key short-, medium-, and long-term moving averages while momentum indicators such as MACD and ADX highlighted prevailing downside risk. Resistance levels at the Ichimoku Kijun and MA-50, alongside a modestly below-neutral RSI and ongoing volatility, signaled persistent weakness despite isolated intraday strength as detailed in the recent market analysis highlighting short term drivers.


-
 Afghanistan
-
 Albania
-
 Algeria
-
 Angola
-
 Argentina
-
 Armenia
-
 Australia
-
 Austria
-
 Azerbaijan
-
 Bahamas
-
 Bahrain
-
 Bangladesh
-
 Belarus
-
 Belgium
-
 Bolivia
-
 Botswana
-
 Brazil
-
 Brunei
-
 Bulgaria
-
 Cambodia
-
 Cameroon
-
 Canada
-
 Chile
Chile
-
 China
China
-
 Colombia
-
 Congo
Congo
-
 Costa Rica
-
 Cote d'Ivoire
-
 Croatia
-
 Cuba
Cuba
-
 Cyprus
-
 Czechia
-
 DR Congo
-
 Denmark
-
 Dominican Republic
-
 Ecuador
-
 Egypt
Egypt
-
 El Salvador
-
 Estonia
-
 Eswatini
-
 Ethiopia
-
 Finland
-
 France
-
 Georgia
-
 Germany
-
 Ghana
Ghana
-
 Greece
-
 Haiti
Haiti
-
 Hong Kong
-
 Hungary
-
 India
India
-
 Indonesia
-
 Iran, Islamic republic
-
 Iraq
Iraq
-
 Ireland
-
 Israel
-
 Italy
Italy
-
 Jamaica
-
 Japan
Japan
-
 Jordan
-
 Kazakhstan
-
 Kenya
Kenya
-
 Korea
Korea
-
 Kuwait
-
 Kyrgyzstan
-
 Laos
Laos
-
 Latvia
-
 Lebanon
-
 Lesotho
-
 Libya
Libya
-
 Lithuania
-
 Luxembourg
-
 Madagascar
-
 Malaysia
-
 Malta
Malta
-
 Mauritius
-
 Mexico
-
 Moldova
-
 Mongolia
-
 Montenegro
-
 Morocco
-
 Mozambique
-
 Myanmar
-
 Namibia
-
 Nepal
Nepal
-
 Netherlands
-
 New Zealand
-
 Nigeria
-
 North Macedonia
-
 Norway
-
 Oman
Oman
-
 Pakistan
-
 Palestine
-
 Panama
-
 Papua New Guinea
-
 Paraguay
-
 Peru
Peru
-
 Philippines
-
 Poland
-
 Portugal
-
 Puerto Rico
-
 Qatar
Qatar
-
 Reunion
-
 Romania
-
 Rwanda
-
 Saudi Arabia
-
 Serbia
-
 Singapore
-
 Slovakia
-
 Slovenia
-
 Somalia
-
 South Africa
-
 Spain
Spain
-
 Sri Lanka
-
 Sweden
-
 Switzerland
-
 Syria
Syria
-
 Taiwan
-
 Tajikistan
-
 Tanzania
-
 Thailand
-
 Trinidad and Tobago
-
 Tunisia
-
 Turkey
-
 UAE
UAE
-
 Uganda
-
 Ukraine
-
 United Kingdom
-
United States
-
 Uruguay
-
 Uzbekistan
-
 Venezuela
-
 Vietnam
-
 Yemen
Yemen
-
 Zambia
-
 Zimbabwe
- Forex
- Crypto
