
Solana drifts near $123 as late-stage correction deepens and buyers remain cautious

Solana is trading near a critical inflection point on Friday after a prolonged and damaging correction erased much of its autumn advance. Price is hovering around the $122 to $123 zone, where downside momentum is slowing, but the broader structure continues to favor sellers rather than a confirmed recovery.
Highlights
- Solana trades near $123 after a steady decline from October highs.
- Price remains below the full EMA stack, with resistance layered from $131 to $169.
- Derivatives data shows long-side liquidations as traders attempt early bottom calls.
The market is no longer selling off with urgency, yet there is little evidence of meaningful accumulation. This has shifted Solana into a compression phase, where exhaustion is building but confirmation remains absent.
Bearish structure dominates higher timeframes
On the daily chart, Solana’s technical damage is clear. Price is trading well below the 20, 50, 100, and 200-day EMAs, which are now cleanly aligned lower between roughly $131 and $169. This configuration confirms that the dominant trend has flipped decisively against bulls and explains why every rebound attempt since late October has failed quickly.
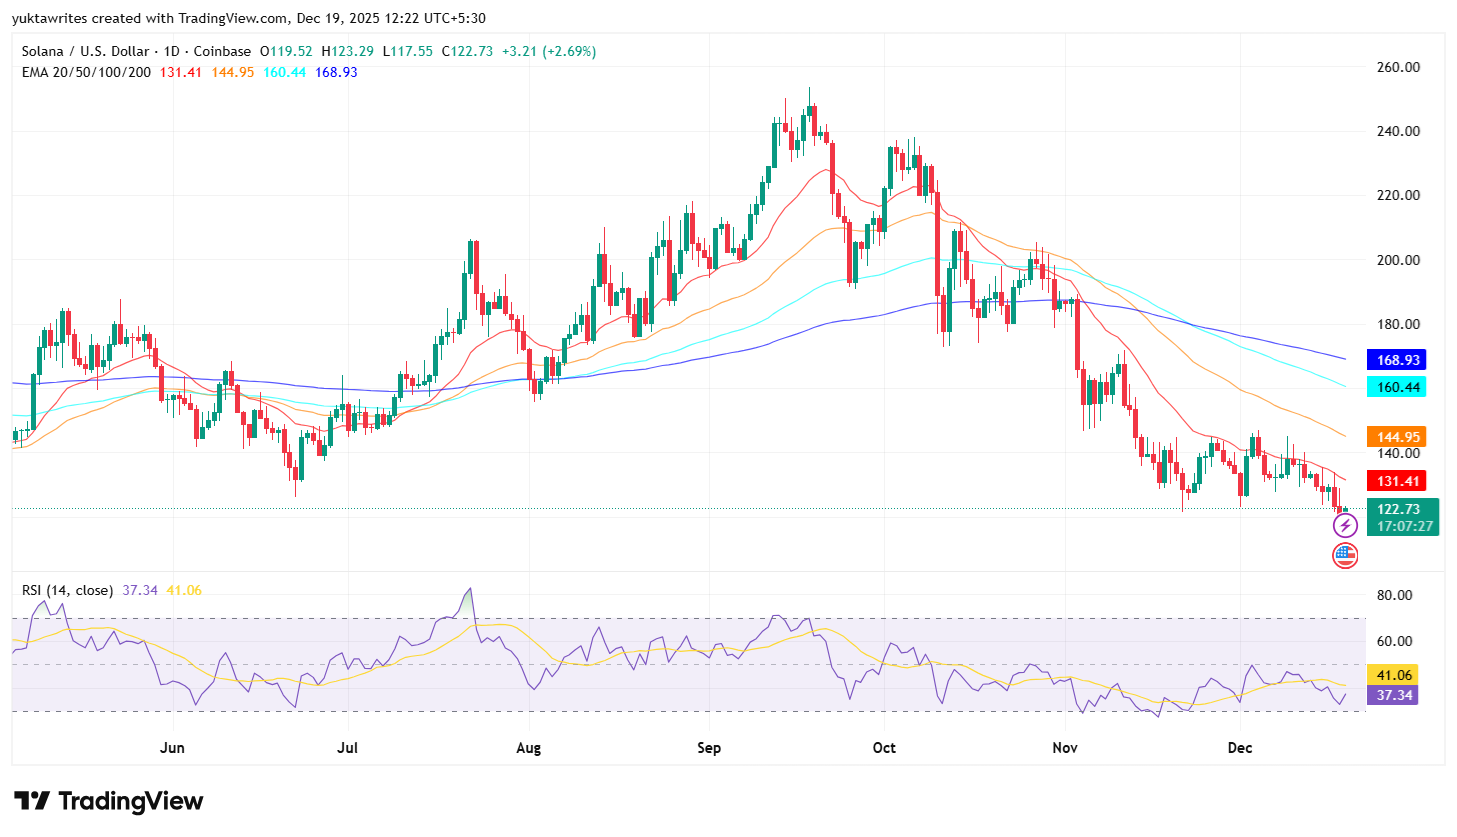
SOL price dynamics (Source: TradingView)
The breakdown below the $180 area marked a structural failure of the prior uptrend. Since then, SOL has printed a consistent sequence of lower highs and lower lows, migrating steadily toward the lower end of its multi-month range. The inability to reclaim even the 20-day EMA underscores the lack of buyer follow-through and keeps rallies firmly corrective in nature.
Momentum indicators reflect weakness without panic. Daily RSI is holding in the high-30s, signaling sustained selling pressure but not the kind of extreme readings associated with forced liquidation events. Earlier declines this year were followed by sharp RSI compression and fast rebounds. The current flattening suggests sellers remain in control, but with diminishing urgency. That profile often precedes consolidation rather than an immediate continuation lower.
Intraday stabilization contrasts with bearish bias
Lower-timeframe charts highlight the recent slowdown in selling. On the 30-minute chart, Solana flushed toward the $118 to $119 area before staging a modest rebound. Supertrend has flipped marginally supportive near $119, and Parabolic SAR has moved beneath price, indicating that immediate downside pressure has eased.
However, this bounce remains corrective rather than impulsive. Price continues to stall beneath the $124 to $126 zone, which previously acted as support and has now turned into short-term resistance. Repeated failures in this area suggest that sellers are still active on rallies. Without sustained acceptance above $126, intraday strength should be treated as stabilization rather than trend repair.
The broader context remains defensive. Short-term buyers appear more focused on tactical rebounds than on building longer-term positions, reinforcing the idea that the market is compressing rather than reversing.
Flows and derivatives show hesitation, not accumulation
Spot flow data continues to lean decisively negative. Solana has recorded consistent net outflows in recent weeks, with selling pressure persisting even as price approaches lower levels. The absence of sustained inflows indicates that larger participants are not yet accumulating with conviction. In previous bullish phases, SOL recoveries were accompanied by visible improvements in spot flows, a signal that is currently missing.
Derivatives data adds another layer of tension. Trading volume has increased, but open interest has declined, pointing to position reduction rather than aggressive new risk-taking. Long-short ratios remain skewed toward longs, particularly among top traders, yet liquidation data shows that recent losses have been dominated by long liquidations over the past 12 and 24 hours.
This combination often appears in late-stage corrections, where traders attempt to anticipate a bottom before higher-timeframe structure improves. Such premature positioning can delay recovery, as repeated long liquidations suppress upside momentum even when selling pressure slows.
Key levels define the next phase
From a technical perspective, Solana remains vulnerable as long as it trades below the descending EMA band. The $118 to $120 region now represents a near-term demand zone where selling pressure has eased, but a decisive break below it would expose deeper downside toward the low $110s.
On the upside, the $130 to $135 region is the first meaningful area that bulls would need to reclaim to signal that bearish control is weakening. A daily close above $135 would shift the outlook from continuation risk toward consolidation. Until then, rallies are likely to encounter supply rather than sustained demand.
In earlier coverage, Solana was flagged as structurally weak after repeated failures to reclaim major short-term EMAs and persistent spot outflows. The current price behavior aligns with that assessment. Momentum is fading, but flows and positioning data still point to distribution rather than accumulation, keeping the broader outlook cautious.


-
 Afghanistan
-
 Albania
-
 Algeria
-
 Angola
-
 Argentina
-
 Armenia
-
 Australia
-
 Austria
-
 Azerbaijan
-
 Bahamas
-
 Bahrain
-
 Bangladesh
-
 Belarus
-
 Belgium
-
 Bolivia
-
 Botswana
-
 Brazil
-
 Brunei
-
 Bulgaria
-
 Cambodia
-
 Cameroon
-
 Canada
-
 Chile
Chile
-
 China
China
-
 Colombia
-
 Congo
Congo
-
 Costa Rica
-
 Cote d'Ivoire
-
 Croatia
-
 Cuba
Cuba
-
 Cyprus
-
 Czechia
-
 DR Congo
-
 Denmark
-
 Dominican Republic
-
 Ecuador
-
 Egypt
Egypt
-
 El Salvador
-
 Estonia
-
 Eswatini
-
 Ethiopia
-
 Finland
-
 France
-
 Georgia
-
 Germany
-
 Ghana
Ghana
-
 Greece
-
 Haiti
Haiti
-
 Hong Kong
-
 Hungary
-
 India
India
-
 Indonesia
-
 Iran, Islamic republic
-
 Iraq
Iraq
-
 Ireland
-
 Israel
-
 Italy
Italy
-
 Jamaica
-
 Japan
Japan
-
 Jordan
-
 Kazakhstan
-
 Kenya
Kenya
-
 Korea
Korea
-
 Kuwait
-
 Kyrgyzstan
-
 Laos
Laos
-
 Latvia
-
 Lebanon
-
 Lesotho
-
 Libya
Libya
-
 Lithuania
-
 Luxembourg
-
 Madagascar
-
 Malaysia
-
 Malta
Malta
-
 Mauritius
-
 Mexico
-
 Moldova
-
 Mongolia
-
 Montenegro
-
 Morocco
-
 Mozambique
-
 Myanmar
-
 Namibia
-
 Nepal
Nepal
-
 Netherlands
-
 New Zealand
-
 Nigeria
-
 North Macedonia
-
 Norway
-
 Oman
Oman
-
 Pakistan
-
 Palestine
-
 Panama
-
 Papua New Guinea
-
 Paraguay
-
 Peru
Peru
-
 Philippines
-
 Poland
-
 Portugal
-
 Puerto Rico
-
 Qatar
Qatar
-
 Reunion
-
 Romania
-
 Rwanda
-
 Saudi Arabia
-
 Serbia
-
 Singapore
-
 Slovakia
-
 Slovenia
-
 Somalia
-
 South Africa
-
 Spain
Spain
-
 Sri Lanka
-
 Sweden
-
 Switzerland
-
 Syria
Syria
-
 Taiwan
-
 Tajikistan
-
 Tanzania
-
 Thailand
-
 Trinidad and Tobago
-
 Tunisia
-
 Turkey
-
 UAE
UAE
-
 Uganda
-
 Ukraine
-
 United Kingdom
-
United States
-
 Uruguay
-
 Uzbekistan
-
 Venezuela
-
 Vietnam
-
 Yemen
Yemen
-
 Zambia
-
 Zimbabwe
- Forex
- Crypto
