
Solana price prediction: Will $60.19 support hold as SOL drops 4.57%?

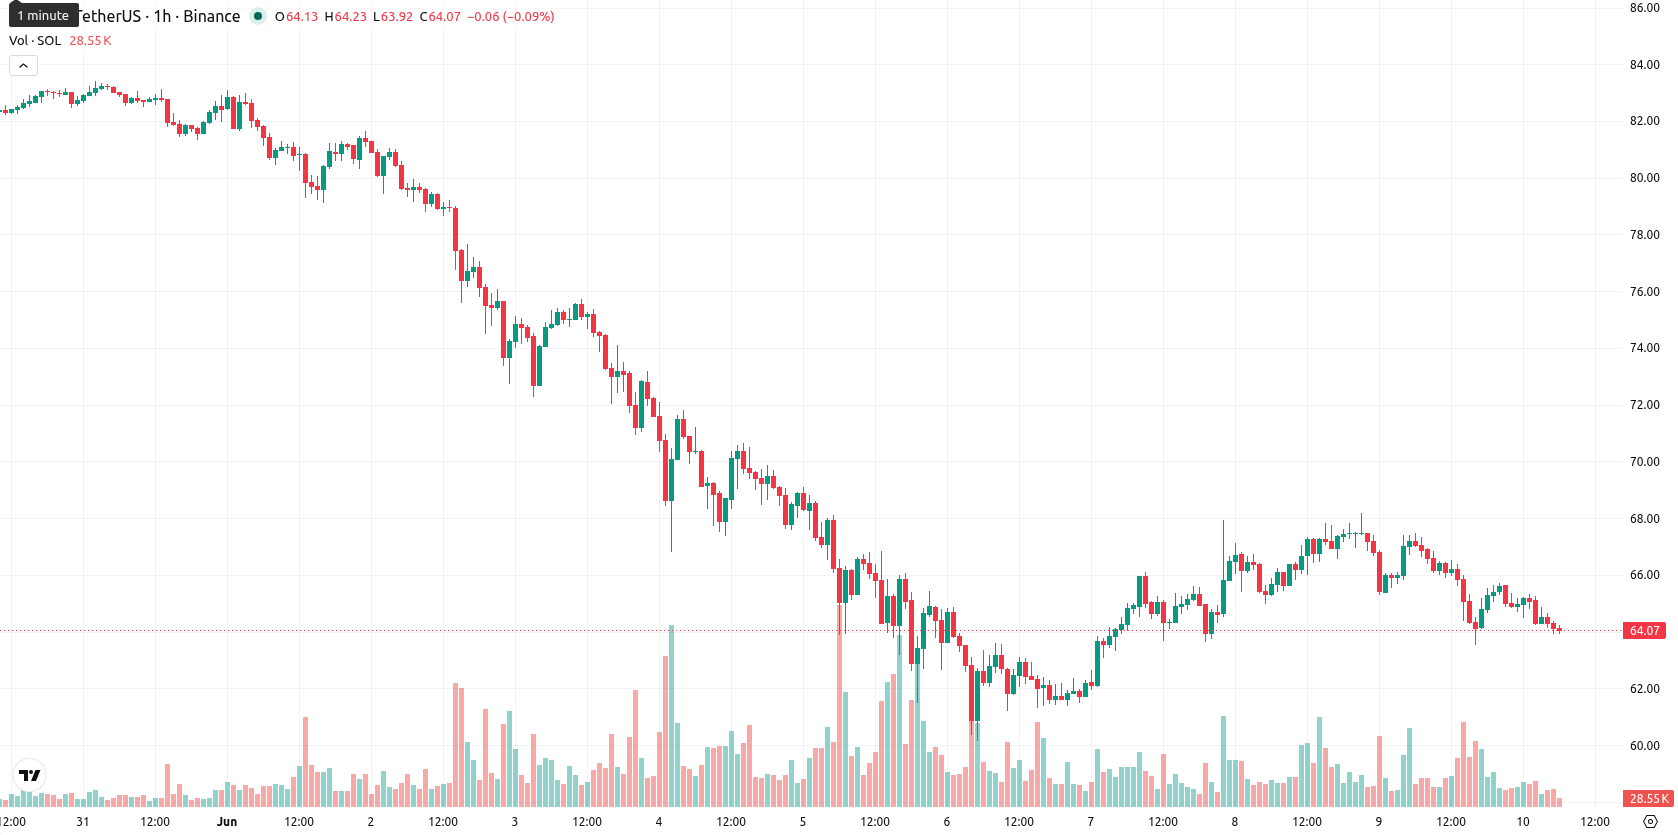
Solana (SOL) is trading at $64.11, reflecting a daily decline of 4.57%. The asset currently sits below its key moving averages.
Highlights
- SOL Strategies liquidated 65,001 SOL, reducing its holdings by 12.5% to address over $4.1 million in debt, intensifying immediate sell pressure.
- Solana’s stablecoin supply surpassed $16 billion amid strong network activity, while ecosystem leaders advocated for the CLARITY Act to support developers.
- SOL/USD remains bearish, trading under key moving averages and support, with indicators signaling high likelihood of further downside toward $60.19–$66.78.
Debt-driven token sales intensify supply pressures despite network growth
SOL Strategies, a Solana treasury firm, sold 65,001 SOL tokens to address over $4.1 million in debt, reducing its holdings by nearly 12.5% and releasing this amount onto the market, which elevated immediate supply-side pressure. This activity followed continued high network usage, as Solana’s stablecoin supply surpassed $16 billion and development efforts remained focused on decentralized finance and payment applications. In parallel, Solana ecosystem leaders engaged with U.S. lawmakers to promote the CLARITY Act, aiming for enhanced legal protections for open-source contributors and infrastructure developers.
Broad intraday seller control as indicators reinforce resistance barriers
On the hourly chart, SOL/USD trades below the MA-20 at $65.08 and the MA-50 at $66.00, with the MA-200 well above at $101.42. The Ichimoku Kijun line at $65.51 serves as immediate resistance. Momentum readings confirm weak market conditions: MACD remains on a Sell signal, ADX indicates a neutral trend, and RSI stands at 36.44 (Sell). Both CCI and BBP are in oversold territory, while Stoch RSI is neutral and AO reads Sell, collectively reflecting strong intraday seller dominance and a lack of divergence across technical signals.
Downside risks persist as range-bound trading dominates outlook
Over the short term, the typical volatility band is expected between $60.19 and $66.78, reflecting the recent range. Downside risk remains pronounced given the prevailing technical setup, with the probability of further declines much higher than a rebound. If SOL/USD stabilizes, a period of sideways consolidation is likely; a sustained move above $65.51 would be required to signal bullish reversal potential, while a break below support could see the pair targeting $60.19 or even lower.
Earlier, analysts noted that Solana was displaying short-term bullish momentum but remained highly sensitive to institutional flows and broader liquidity conditions. The recent debt-driven token sale by SOL Strategies and persistent technical weakness reinforce downside risk, making immediate support at $60.19 a critical threshold for traders to monitor amid ongoing volatility.


-
 Afghanistan
-
 Albania
-
 Algeria
-
 Angola
-
 Argentina
-
 Armenia
-
 Australia
-
 Austria
-
 Azerbaijan
-
 Bahamas
-
 Bahrain
-
 Bangladesh
-
 Belarus
-
 Belgium
-
 Bolivia
-
 Botswana
-
 Brazil
-
 Brunei
-
 Bulgaria
-
 Cambodia
-
 Cameroon
-
 Canada
-
 Chile
Chile
-
 China
China
-
 Colombia
-
 Congo
Congo
-
 Costa Rica
-
 Cote d'Ivoire
-
 Croatia
-
 Cuba
Cuba
-
 Cyprus
-
 Czechia
-
 DR Congo
-
 Denmark
-
 Dominican Republic
-
 Ecuador
-
 Egypt
Egypt
-
 El Salvador
-
 Estonia
-
 Eswatini
-
 Ethiopia
-
 Finland
-
 France
-
 Georgia
-
 Germany
-
 Ghana
Ghana
-
 Greece
-
 Haiti
Haiti
-
 Hong Kong
-
 Hungary
-
 India
India
-
 Indonesia
-
 Iran, Islamic republic
-
 Iraq
Iraq
-
 Ireland
-
 Israel
-
 Italy
Italy
-
 Jamaica
-
 Japan
Japan
-
 Jordan
-
 Kazakhstan
-
 Kenya
Kenya
-
 Korea
Korea
-
 Kuwait
-
 Kyrgyzstan
-
 Laos
Laos
-
 Latvia
-
 Lebanon
-
 Lesotho
-
 Libya
Libya
-
 Lithuania
-
 Luxembourg
-
 Madagascar
-
 Malaysia
-
 Malta
Malta
-
 Mauritius
-
 Mexico
-
 Moldova
-
 Mongolia
-
 Montenegro
-
 Morocco
-
 Mozambique
-
 Myanmar
-
 Namibia
-
 Nepal
Nepal
-
 Netherlands
-
 New Zealand
-
 Nigeria
-
 North Macedonia
-
 Norway
-
 Oman
Oman
-
 Pakistan
-
 Palestine
-
 Panama
-
 Papua New Guinea
-
 Paraguay
-
 Peru
Peru
-
 Philippines
-
 Poland
-
 Portugal
-
 Puerto Rico
-
 Qatar
Qatar
-
 Reunion
-
 Romania
-
 Rwanda
-
 Saudi Arabia
-
 Serbia
-
 Singapore
-
 Slovakia
-
 Slovenia
-
 Somalia
-
 South Africa
-
 Spain
Spain
-
 Sri Lanka
-
 Sweden
-
 Switzerland
-
 Syria
Syria
-
 Taiwan
-
 Tajikistan
-
 Tanzania
-
 Thailand
-
 Trinidad and Tobago
-
 Tunisia
-
 Turkey
-
 UAE
UAE
-
 Uganda
-
 Ukraine
-
 United Kingdom
-
United States
-
 Uruguay
-
 Uzbekistan
-
 Venezuela
-
 Vietnam
-
 Yemen
Yemen
-
 Zambia
-
 Zimbabwe
- Forex
- Crypto
