
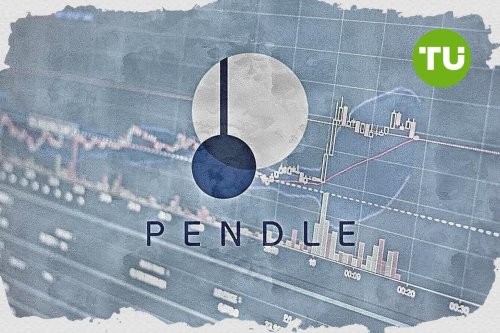
Pendle price prediction: More downside ahead? PENDLE drops 9.4%

Pendle (PENDLE) is currently trading at $1.726, showing a sharp daily decline of 9.40%. The asset remains well below its 20-, 50-, and 200-day moving averages, confirming that bearish momentum persists across all major timeframes.
Highlights
- PENDLE trades at $1.726, significantly below MA-20 ($2.1797), MA-50 ($2.3931), and MA-200 ($3.8195), confirming persistent bearish pressure across all timeframes.
- Daily technical indicators show strong downward momentum, with the MACD, ADX, and negative BBP (–0.0849) aligning with a sharp 9.40% price drop today and closing near the session low ($1.723).
- Expected price range for the next five trading days is $1.60 to $1.90, with a probability of price increase below 20%, as sellers maintain control.
Persistent selling pressure as technical signals confirm oversold conditions
PENDLE continues to face strong bearish technical signals, with price action consistently below MA-20 ($2.1797), MA-50 ($2.3931), and MA-200 ($3.8195). The nearest resistance is defined by the daily Ichimoku Kijun level at $2.3075, while support is seen just below the current session low. Bearish momentum is reinforced by negative readings from MACD and ADX, and all key oscillators — including RSI (32.66), CCI (–94.12), and Stoch RSI — indicate the asset remains in oversold territory. A negative BBP (–0.0849) confirms sellers' dominance, with intraday price action holding near session lows after significant downward movement.

Limited rebound prospects as volatility and downside risk dominate outlook
Over the next five trading days, PENDLE is expected to fluctuate within a volatility band of $1.60 to $1.90. The likelihood of a price increase remains below 20%, as persistent negative signals and high volatility make sideways or lower price action more probable. A break above $1.90 could open the way to $2.00–$2.10, but a move below $1.60 would expose further downside risk, as sellers continue to control the short-term trend.
Previously it was reported that Pendle (PENDLE) remains in a pronounced downtrend, trading well below its key moving averages and facing persistent bearish momentum, with strong negative signals from MACD and ADX alongside deeply oversold RSI, Stoch RSI, and CCI readings. The nearest resistance sits near $2.35, while ongoing volatility and dominant selling pressure keep rebound odds low, with price likely to consolidate or decline further in the near term.


Latest Pendle News


-
 Afghanistan
-
 Albania
-
 Algeria
-
 Angola
-
 Argentina
-
 Armenia
-
 Australia
-
 Austria
-
 Azerbaijan
-
 Bahamas
-
 Bahrain
-
 Bangladesh
-
 Belarus
-
 Belgium
-
 Bolivia
-
 Botswana
-
 Brazil
-
 Brunei
-
 Bulgaria
-
 Cambodia
-
 Cameroon
-
 Canada
-
 Chile
Chile
-
 China
China
-
 Colombia
-
 Congo
Congo
-
 Costa Rica
-
 Cote d'Ivoire
-
 Croatia
-
 Cuba
Cuba
-
 Cyprus
-
 Czechia
-
 DR Congo
-
 Denmark
-
 Dominican Republic
-
 Ecuador
-
 Egypt
Egypt
-
 El Salvador
-
 Estonia
-
 Eswatini
-
 Ethiopia
-
 Finland
-
 France
-
 Georgia
-
 Germany
-
 Ghana
Ghana
-
 Greece
-
 Haiti
Haiti
-
 Hong Kong
-
 Hungary
-
 India
India
-
 Indonesia
-
 Iran, Islamic republic
-
 Iraq
Iraq
-
 Ireland
-
 Israel
-
 Italy
Italy
-
 Jamaica
-
 Japan
Japan
-
 Jordan
-
 Kazakhstan
-
 Kenya
Kenya
-
 Korea
Korea
-
 Kuwait
-
 Kyrgyzstan
-
 Laos
Laos
-
 Latvia
-
 Lebanon
-
 Lesotho
-
 Libya
Libya
-
 Lithuania
-
 Luxembourg
-
 Madagascar
-
 Malaysia
-
 Malta
Malta
-
 Mauritius
-
 Mexico
-
 Moldova
-
 Mongolia
-
 Montenegro
-
 Morocco
-
 Mozambique
-
 Myanmar
-
 Namibia
-
 Nepal
Nepal
-
 Netherlands
-
 New Zealand
-
 Nigeria
-
 North Macedonia
-
 Norway
-
 Oman
Oman
-
 Pakistan
-
 Palestine
-
 Panama
-
 Papua New Guinea
-
 Paraguay
-
 Peru
Peru
-
 Philippines
-
 Poland
-
 Portugal
-
 Puerto Rico
-
 Qatar
Qatar
-
 Reunion
-
 Romania
-
 Rwanda
-
 Saudi Arabia
-
 Serbia
-
 Singapore
-
 Slovakia
-
 Slovenia
-
 Somalia
-
 South Africa
-
 Spain
Spain
-
 Sri Lanka
-
 Sweden
-
 Switzerland
-
 Syria
Syria
-
 Taiwan
-
 Tajikistan
-
 Tanzania
-
 Thailand
-
 Trinidad and Tobago
-
 Tunisia
-
 Turkey
-
 UAE
UAE
-
 Uganda
-
 Ukraine
-
 United Kingdom
-
United States
-
 Uruguay
-
 Uzbekistan
-
 Venezuela
-
 Vietnam
-
 Yemen
Yemen
-
 Zambia
-
 Zimbabwe
- Forex
- Crypto
