
-7.07% for Pendle as increased activity highlights selling pressure

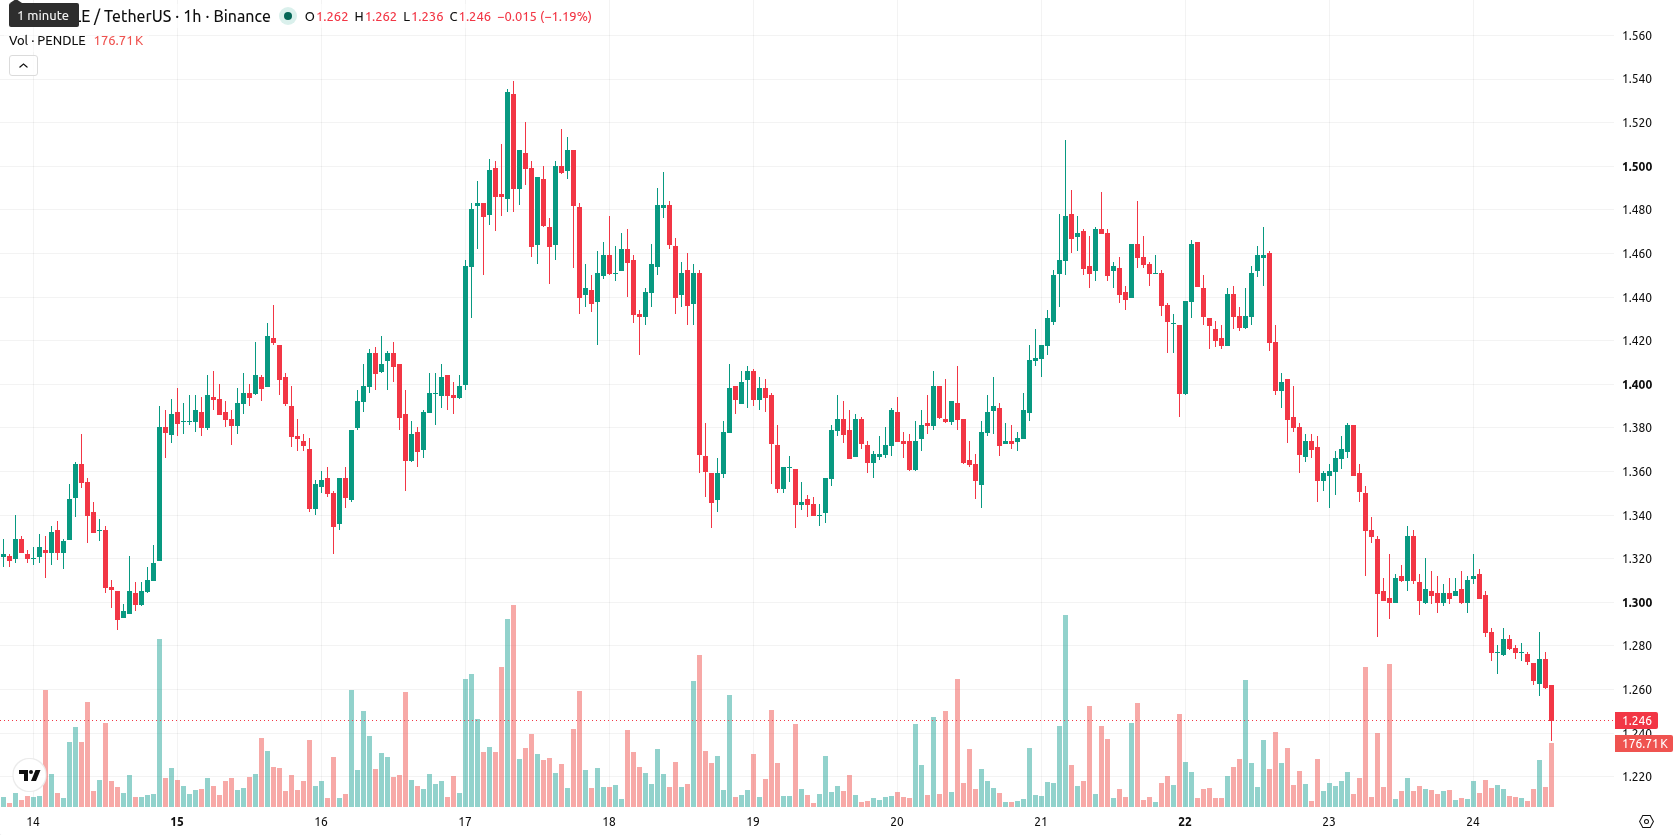
Pendle (PENDLE) is trading at $1.23, recording a daily drop of 7.07%. The asset closed near the session low and is currently positioned below its key moving averages.
Highlights
- Pendle is experiencing heightened trading activity, signaling increased market engagement and liquidity alongside intensified selling pressure.
- Recent trading has been marked by strong downward momentum, as sellers exert control amid sustained volatility.
- The price closed at $1.236, with technicals indicating a high likelihood of further downside within the $1.185 to $1.287 range, barring a breakout above $1.296.
Selling momentum intensifies as trading activity and liquidity rise
Pendle has seen a notable uptick in trading activity and market participation, according to Ambcrypto. This higher transaction volume indicates active engagement among traders that can increase market liquidity and potential for volatile moves. While such participation might foster opportunities for sharper price reactions in both directions, it has recently been associated with intense selling momentum.
Downward momentum confirmed as technicals signal lack of buyers
On the hourly chart, PENDLE is trading below its MA-20 and MA-50, and remains well under the daily MA-200 — a clear alignment of downward momentum across timeframes. The Ichimoku Kijun on the daily stands at $1.296, marking the nearest resistance level. Momentum indicators present a negative picture, with both MACD and ADX showing strong selling pressure. RSI is in the low 30s, CCI issues a Sell signal, and BBP confirms seller dominance, while Awesome Oscillator remains neutral. Stoch RSI is neutral, suggesting oversold conditions but not a full oscillator consensus. The convergence of these technicals supports the session's sharp drop and signals a lack of bullish counter-trend strength.
Downside risk persists as narrow range limits rebound potential
Looking ahead to the next 2–3 sessions, PENDLE is projected to fluctuate within a $1.185 to $1.287 range, a volatility band relative to current levels. The probability of a downward breakout remains high, while an immediate reversal to the upside is viewed as unlikely. A sideways move within this corridor forms the baseline scenario, with a push above $1.296 required to unlock further bullish potential. Conversely, a fall through $1.185 would reinforce existing downward momentum and expose the asset to additional losses.
Earlier, analysts noted that Pendle was experiencing sustained bearish momentum as technical signals pointed to continued weakness. The latest surge in trading activity reinforces the existing downward bias, highlighting the need for traders to monitor for heightened volatility and potential breaks in the established price corridor.


-
 Afghanistan
-
 Albania
-
 Algeria
-
 Angola
-
 Argentina
-
 Armenia
-
 Australia
-
 Austria
-
 Azerbaijan
-
 Bahamas
-
 Bahrain
-
 Bangladesh
-
 Belarus
-
 Belgium
-
 Bolivia
-
 Botswana
-
 Brazil
-
 Brunei
-
 Bulgaria
-
 Cambodia
-
 Cameroon
-
 Canada
-
 Chile
Chile
-
 China
China
-
 Colombia
-
 Congo
Congo
-
 Costa Rica
-
 Cote d'Ivoire
-
 Croatia
-
 Cuba
Cuba
-
 Cyprus
-
 Czechia
-
 DR Congo
-
 Denmark
-
 Dominican Republic
-
 Ecuador
-
 Egypt
Egypt
-
 El Salvador
-
 Estonia
-
 Eswatini
-
 Ethiopia
-
 Finland
-
 France
-
 Georgia
-
 Germany
-
 Ghana
Ghana
-
 Greece
-
 Haiti
Haiti
-
 Hong Kong
-
 Hungary
-
 India
India
-
 Indonesia
-
 Iran, Islamic republic
-
 Iraq
Iraq
-
 Ireland
-
 Israel
-
 Italy
Italy
-
 Jamaica
-
 Japan
Japan
-
 Jordan
-
 Kazakhstan
-
 Kenya
Kenya
-
 Korea
Korea
-
 Kuwait
-
 Kyrgyzstan
-
 Laos
Laos
-
 Latvia
-
 Lebanon
-
 Lesotho
-
 Libya
Libya
-
 Lithuania
-
 Luxembourg
-
 Madagascar
-
 Malaysia
-
 Malta
Malta
-
 Mauritius
-
 Mexico
-
 Moldova
-
 Mongolia
-
 Montenegro
-
 Morocco
-
 Mozambique
-
 Myanmar
-
 Namibia
-
 Nepal
Nepal
-
 Netherlands
-
 New Zealand
-
 Nigeria
-
 North Macedonia
-
 Norway
-
 Oman
Oman
-
 Pakistan
-
 Palestine
-
 Panama
-
 Papua New Guinea
-
 Paraguay
-
 Peru
Peru
-
 Philippines
-
 Poland
-
 Portugal
-
 Puerto Rico
-
 Qatar
Qatar
-
 Reunion
-
 Romania
-
 Rwanda
-
 Saudi Arabia
-
 Serbia
-
 Singapore
-
 Slovakia
-
 Slovenia
-
 Somalia
-
 South Africa
-
 Spain
Spain
-
 Sri Lanka
-
 Sweden
-
 Switzerland
-
 Syria
Syria
-
 Taiwan
-
 Tajikistan
-
 Tanzania
-
 Thailand
-
 Trinidad and Tobago
-
 Tunisia
-
 Turkey
-
 UAE
UAE
-
 Uganda
-
 Ukraine
-
 United Kingdom
-
United States
-
 Uruguay
-
 Uzbekistan
-
 Venezuela
-
 Vietnam
-
 Yemen
Yemen
-
 Zambia
-
 Zimbabwe
- Forex
- Crypto
