

Can Pendle avoid deeper losses as oversold conditions limit further selling?

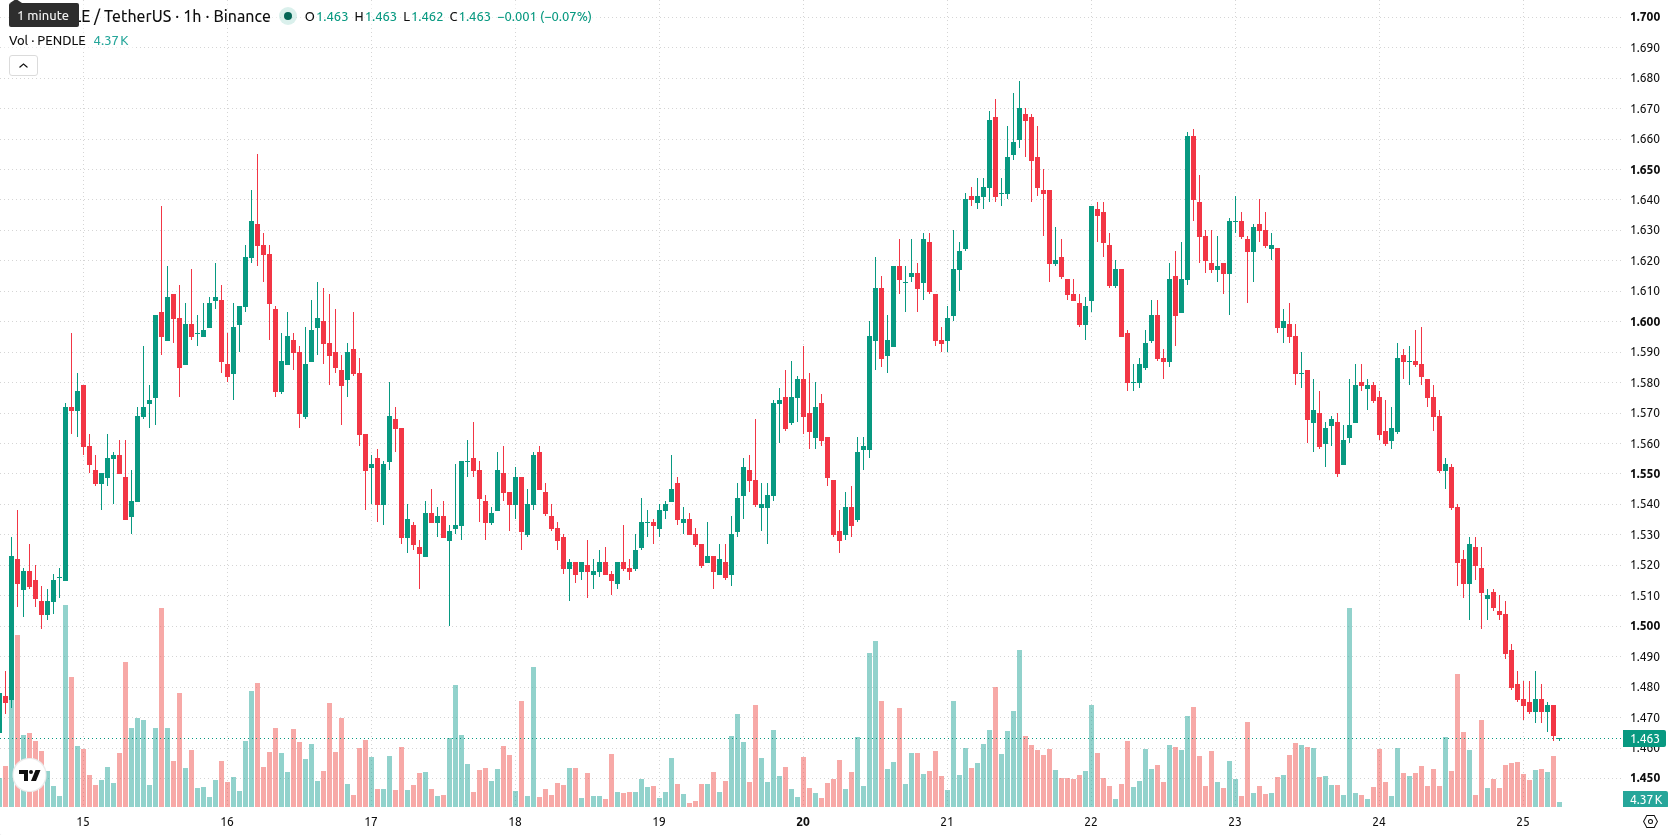
Pendle (PENDLE) is trading at $1.463 after dropping 8.05% on the day and remains below its key moving averages.
 2.087
2.2400
2.087
2.2400
Highlights
- Pendle faces sustained bearish momentum, trading below key moving averages across all observed timeframes.
- Short-term momentum indicators unanimously signal strong selling pressure, with multiple oscillators registering deeply oversold conditions.
- Next 2–3 days are expected to see Pendle move sideways between $1.4174 and $1.5086, with heightened risk for further downside.
Oversold momentum deepens as technical resistance holds
On the h1 chart, PENDLE trades below the MA-20 at $1.5017 and MA-50 at $1.5491, while on the daily timeframe, it stays under the MA-200 at $1.4725. The Ichimoku Kijun acts as immediate resistance at $1.53. MACD and ADX both indicate prevailing sell conditions, and the majority of oscillators add weight to this, with RSI, Stoch RSI, and CCI all deep in oversold territory. Bull/Bear Power also continues to signal seller dominance. The Awesome Oscillator is now neutral, not providing conviction for further moves. Price action has moved sharply lower to $1.463, creating a gap and trading near today's low with moderate volatility. These conditions point to strong intraday bearish momentum, but the oversold readings suggest some caution for new short positions.
Further declines seen likely as volatility and support define range
In the short term, Pendle is expected to stay within the $1.4174 to $1.5086 range over the next two to three sessions. Current volatility and indicator alignment signal a very high probability of further downside, with only a minimal chance of a meaningful rebound. The base scenario is sideways movement inside this corridor. A bullish shift would require a break above the Ichimoku Kijun, while a drop below the lower end of the range would trigger another leg down.
Earlier, analysts noted that Pendle was exhibiting strong bullish momentum supported by positive technical signals and increased protocol activity. The recent shift to pronounced bearish conditions marks a clear change in market structure, positioning the $1.4174 level as a critical downside risk to monitor for confirmation of further weakness.





Latest Pendle News





-
 Afghanistan
-
 Albania
-
 Algeria
-
 Angola
-
 Argentina
-
 Armenia
-
 Australia
-
 Austria
-
 Azerbaijan
-
 Bahamas
-
 Bahrain
-
 Bangladesh
-
 Belarus
-
 Belgium
-
 Bolivia
-
 Botswana
-
 Brazil
-
 Brunei
-
 Bulgaria
-
 Cambodia
-
 Cameroon
-
 Canada
-
 Chile
Chile
-
 China
China
-
 Colombia
-
 Congo
Congo
-
 Costa Rica
-
 Cote d'Ivoire
-
 Croatia
-
 Cuba
Cuba
-
 Cyprus
-
 Czechia
-
 DR Congo
-
 Denmark
-
 Dominican Republic
-
 Ecuador
-
 Egypt
Egypt
-
 El Salvador
-
 Estonia
-
 Eswatini
-
 Ethiopia
-
 Finland
-
 France
-
 Georgia
-
 Germany
-
 Ghana
Ghana
-
 Greece
-
 Haiti
Haiti
-
 Hong Kong
-
 Hungary
-
 India
India
-
 Indonesia
-
 Iran, Islamic republic
-
 Iraq
Iraq
-
 Ireland
-
 Israel
-
 Italy
Italy
-
 Jamaica
-
 Japan
Japan
-
 Jordan
-
 Kazakhstan
-
 Kenya
Kenya
-
 Korea
Korea
-
 Kuwait
-
 Kyrgyzstan
-
 Laos
Laos
-
 Latvia
-
 Lebanon
-
 Lesotho
-
 Libya
Libya
-
 Lithuania
-
 Luxembourg
-
 Madagascar
-
 Malaysia
-
 Malta
Malta
-
 Mauritius
-
 Mexico
-
 Moldova
-
 Mongolia
-
 Montenegro
-
 Morocco
-
 Mozambique
-
 Myanmar
-
 Namibia
-
 Nepal
Nepal
-
 Netherlands
-
 New Zealand
-
 Nigeria
-
 North Macedonia
-
 Norway
-
 Oman
Oman
-
 Pakistan
-
 Palestine
-
 Panama
-
 Papua New Guinea
-
 Paraguay
-
 Peru
Peru
-
 Philippines
-
 Poland
-
 Portugal
-
 Puerto Rico
-
 Qatar
Qatar
-
 Reunion
-
 Romania
-
 Rwanda
-
 Saudi Arabia
-
 Serbia
-
 Singapore
-
 Slovakia
-
 Slovenia
-
 Somalia
-
 South Africa
-
 Spain
Spain
-
 Sri Lanka
-
 Sweden
-
 Switzerland
-
 Syria
Syria
-
 Taiwan
-
 Tajikistan
-
 Tanzania
-
 Thailand
-
 Trinidad and Tobago
-
 Tunisia
-
 Turkey
-
 UAE
UAE
-
 Uganda
-
 Ukraine
-
 United Kingdom
-
United States
-
 Uruguay
-
 Uzbekistan
-
 Venezuela
-
 Vietnam
-
 Yemen
Yemen
-
 Zambia
-
 Zimbabwe
- Forex
- Crypto












