
Flow price prediction: More downside ahead? FLOW drops below key support

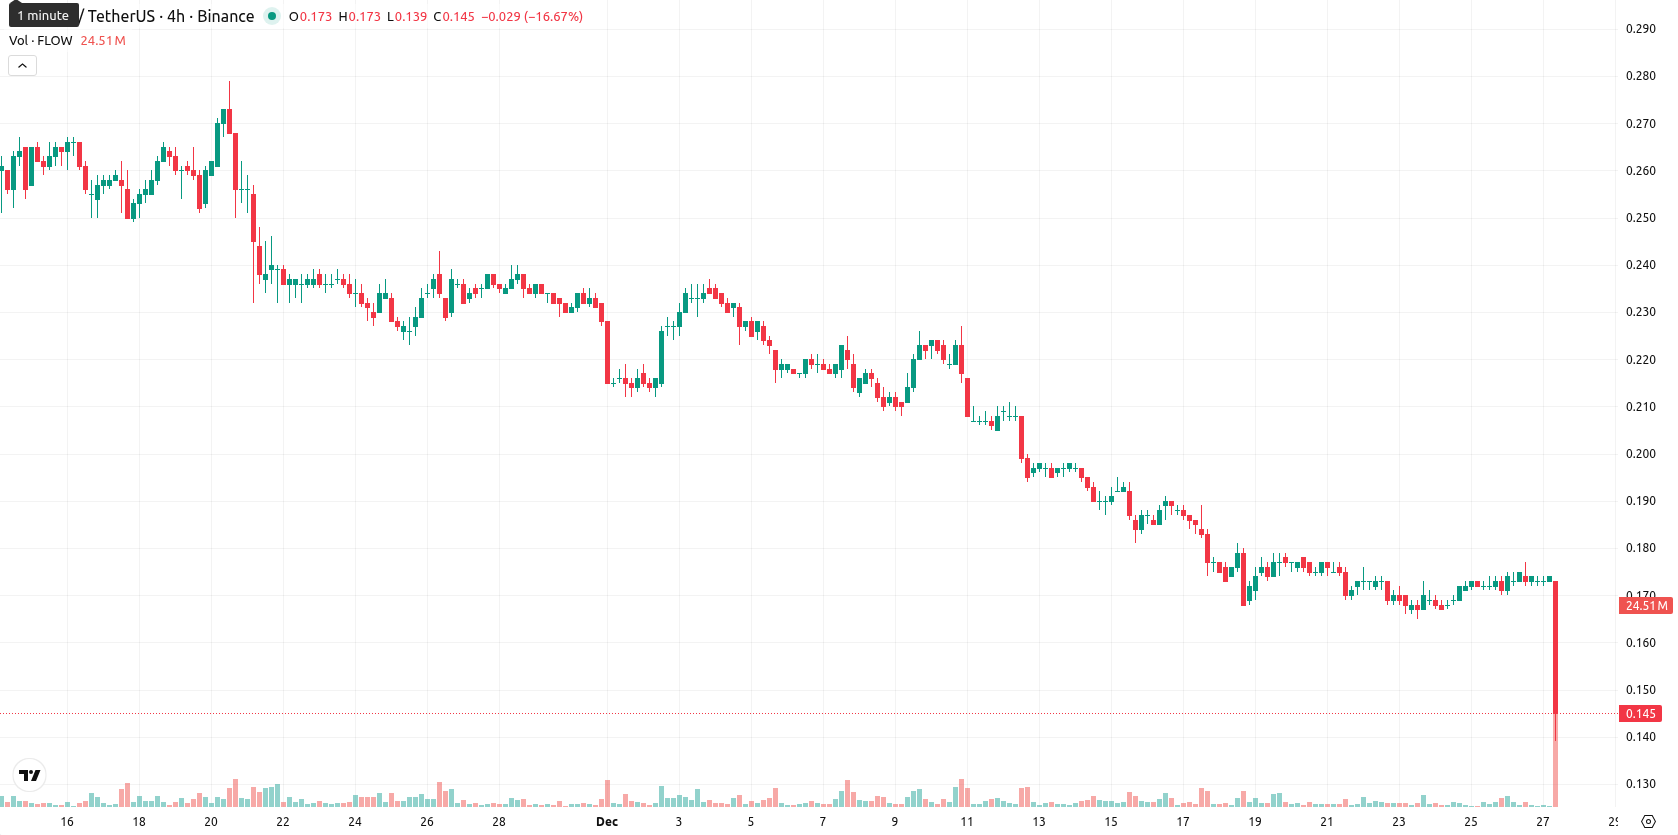
Flow (FLOW) is currently trading at $0.1468, experiencing a sharp daily drop both in absolute and percentage terms. The asset remains under pressure below its key moving averages, specifically the MA-20 at $0.1881, MA-50 at $0.2238, and MA-200 at $0.3240, which signals persistent weakness across all observed timeframes.
Highlights
- FLOW trades at $0.1468, down 16.11% and below MA-20 ($0.1881), MA-50 ($0.2238), and MA-200 ($0.3240), confirming strong multi-timeframe selling pressure.
- Momentum indicators, including MACD (strong sell), ADX (robust trend), and RSI (30.1), confirm dominant bearish sentiment with oversold conditions intensifying.
- Expected five-day price range is $0.1350 to $0.1630, with under 20% probability of an increase, making further declines the most likely scenario.
Bearish momentum intensifies as resistance holds and volatility rises
Technical signals highlight a decisive bearish setup for FLOW. The price faces dynamic resistance at the Ichimoku Kijun line ($0.2010), while support is loosely indicated near round-number levels below the current price. Momentum indicators confirm selling pressure: MACD is in a strong sell configuration, ADX reflects high trend strength, and both RSI (30.1) and CCI (-67) point to a market approaching oversold. Stochastic RSI shows overbought conditions on the daily chart, but oversold signals intraday; Bull/Bear Power also indicates continued seller dominance. There are no significant price gaps between previous close ($0.175) and today’s open ($0.1727), but daily momentum is negative and volatility elevated.
Downside bias prevails as volatility bands define risk boundaries
FLOW is likely to trade within a volatility band of $0.1350 to $0.1630 over the next five trading days, capturing typical fluctuations relative to current levels. Given the current technical and momentum profile, the probability of an upward move is low (less than 20%), with sideways or downward action expected as the baseline scenario. If buyers regain control and a breakout above $0.1630 occurs, resistance at $0.2010 may be tested, while a break below $0.1350 could lead to continued weakness, albeit with the potential for near-term oversold stabilization.
Last time, analysts noted that Flow (FLOW) is trading well below key moving averages with persistent bearish pressure, as negative momentum signals—including MACD, ADX, and deeply oversold oscillators—confirm a sustained downtrend across all timeframes Immediate resistance is marked by the Ichimoku Kijun level, with no visible support nearby, and downside risk remains elevated with a high probability of further losses and minimal rebound potential.


Latest FLOW News


-
 Afghanistan
-
 Albania
-
 Algeria
-
 Angola
-
 Argentina
-
 Armenia
-
 Australia
-
 Austria
-
 Azerbaijan
-
 Bahamas
-
 Bahrain
-
 Bangladesh
-
 Belarus
-
 Belgium
-
 Bolivia
-
 Botswana
-
 Brazil
-
 Brunei
-
 Bulgaria
-
 Cambodia
-
 Cameroon
-
 Canada
-
 Chile
Chile
-
 China
China
-
 Colombia
-
 Congo
Congo
-
 Costa Rica
-
 Cote d'Ivoire
-
 Croatia
-
 Cuba
Cuba
-
 Cyprus
-
 Czechia
-
 DR Congo
-
 Denmark
-
 Dominican Republic
-
 Ecuador
-
 Egypt
Egypt
-
 El Salvador
-
 Estonia
-
 Eswatini
-
 Ethiopia
-
 Finland
-
 France
-
 Georgia
-
 Germany
-
 Ghana
Ghana
-
 Greece
-
 Haiti
Haiti
-
 Hong Kong
-
 Hungary
-
 India
India
-
 Indonesia
-
 Iran, Islamic republic
-
 Iraq
Iraq
-
 Ireland
-
 Israel
-
 Italy
Italy
-
 Jamaica
-
 Japan
Japan
-
 Jordan
-
 Kazakhstan
-
 Kenya
Kenya
-
 Korea
Korea
-
 Kuwait
-
 Kyrgyzstan
-
 Laos
Laos
-
 Latvia
-
 Lebanon
-
 Lesotho
-
 Libya
Libya
-
 Lithuania
-
 Luxembourg
-
 Madagascar
-
 Malaysia
-
 Malta
Malta
-
 Mauritius
-
 Mexico
-
 Moldova
-
 Mongolia
-
 Montenegro
-
 Morocco
-
 Mozambique
-
 Myanmar
-
 Namibia
-
 Nepal
Nepal
-
 Netherlands
-
 New Zealand
-
 Nigeria
-
 North Macedonia
-
 Norway
-
 Oman
Oman
-
 Pakistan
-
 Palestine
-
 Panama
-
 Papua New Guinea
-
 Paraguay
-
 Peru
Peru
-
 Philippines
-
 Poland
-
 Portugal
-
 Puerto Rico
-
 Qatar
Qatar
-
 Reunion
-
 Romania
-
 Rwanda
-
 Saudi Arabia
-
 Serbia
-
 Singapore
-
 Slovakia
-
 Slovenia
-
 Somalia
-
 South Africa
-
 Spain
Spain
-
 Sri Lanka
-
 Sweden
-
 Switzerland
-
 Syria
Syria
-
 Taiwan
-
 Tajikistan
-
 Tanzania
-
 Thailand
-
 Trinidad and Tobago
-
 Tunisia
-
 Turkey
-
 UAE
UAE
-
 Uganda
-
 Ukraine
-
 United Kingdom
-
United States
-
 Uruguay
-
 Uzbekistan
-
 Venezuela
-
 Vietnam
-
 Yemen
Yemen
-
 Zambia
-
 Zimbabwe
- Forex
- Crypto
