
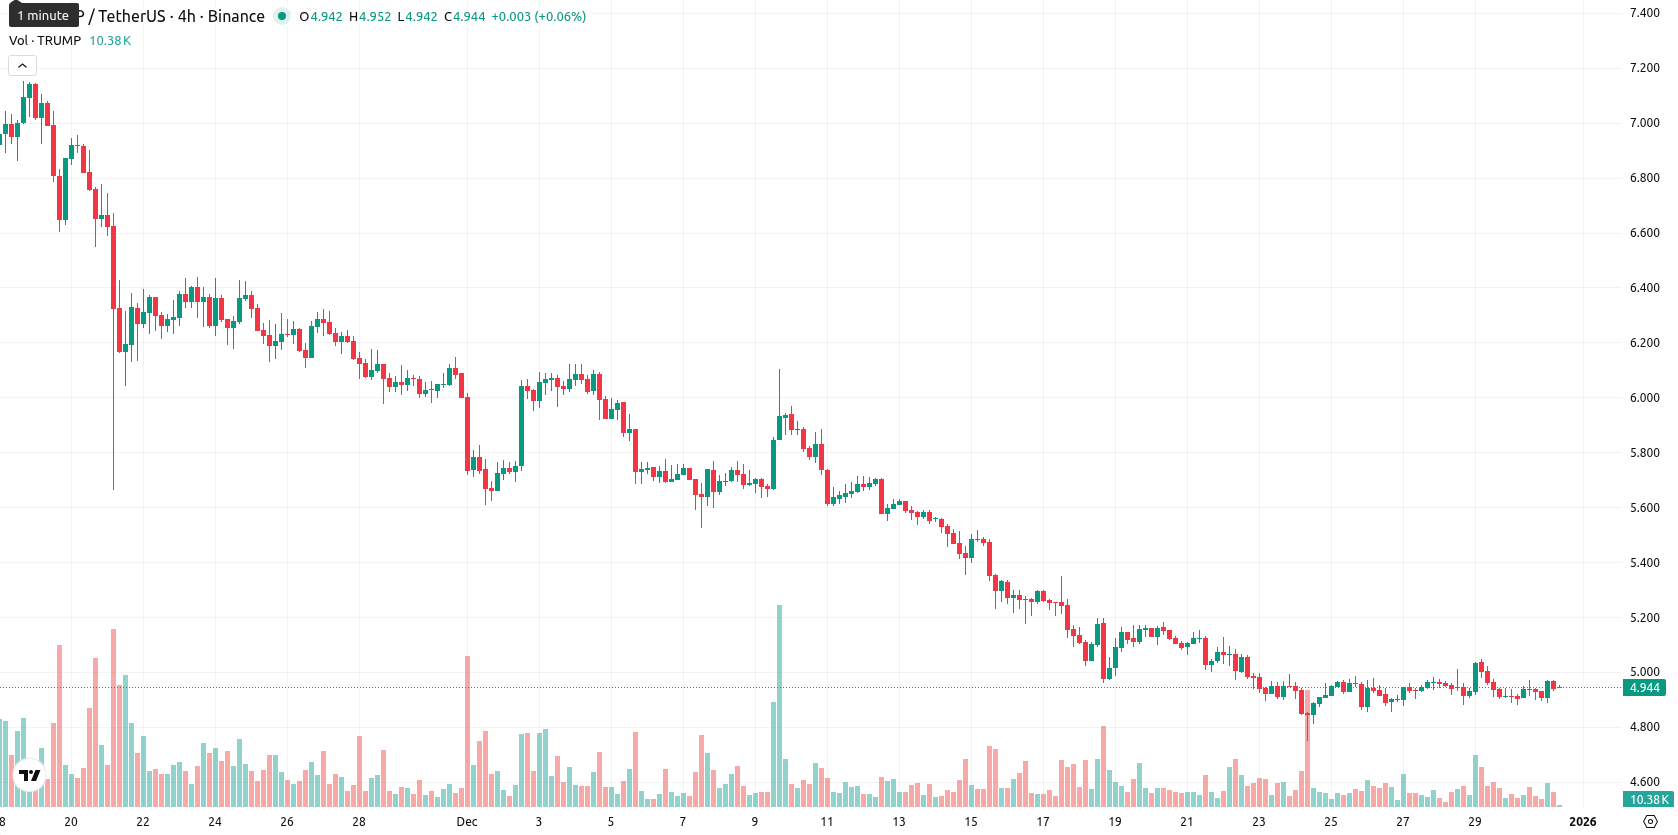
Trump price prediction: Downtrend continues? TRUMP trades below key averages

Official Trump (TRUMP) is trading at $4.94, below the MA-20 ($5.14), MA-50 ($5.89), and MA-200 ($7.80), signaling sustained downward pressure across all major timeframes. The closest dynamic resistance is at the Ichimoku Kijun ($5.44), while short-term support appears near the lower bound of the current trading range.
Highlights
- TRUMP trades at $4.94, below the MA-20 ($5.14), MA-50 ($5.89), and MA-200 ($7.80), signaling continued bearish momentum across major timeframes.
- Momentum indicators including MACD, ADX, RSI at 31, and CCI at –71 point to strong selling pressure and a market nearing oversold conditions.
- Next week's expected range is $4.49 to $4.63, with a less than 20% probability of price increase and heightened risk of further declines below $4.49.
Bearish momentum persists as oversold signals intensify
Momentum signals remain firmly bearish as both the daily MACD and ADX point to ongoing selling pressure. The RSI at 31 and CCI at –71 show the price is nearing oversold territory, further echoed by the BBP, which confirms sellers continue to dominate intraday flows. Daily performance shows a 0.71% gain without any gap between the previous close and today’s open, with the price holding toward the upper end of today’s range ($4.89 – $4.97), indicating moderate intraday volatility and a slight recovery intraday. However, a divergence is evident as Stoch RSI remains neutral and the Awesome Oscillator offers no trend confirmation; short-term recovery attempts are not yet confirmed by broader momentum.
Further downside likely amid constrained weekly range
Looking ahead, the expected range for the next week is $4.49 to $4.63, which keeps the price action well within a controlled corridor around current levels. Based on the weekly indicators, the probability of further price increase is very low (less than 20%), making further declines more likely. The baseline scenario is for the price to remain sideways between support near $4.49 and resistance at $4.63. A bullish scenario would require a break above $5.44, while a bearish scenario unfolds if price slips below $4.49.
Last time, analysts noted that Official Trump (TRUMP) is trading below all major moving averages with persistent negative momentum, as highlighted by bearish MACD, ADX, and RSI readings near oversold levels. Dynamic resistance is seen at $5.45, while the probability of a bullish reversal remains low amid continued intraday selling pressure and downside risk favored within a narrow trading range.


-
 Afghanistan
-
 Albania
-
 Algeria
-
 Angola
-
 Argentina
-
 Armenia
-
 Australia
-
 Austria
-
 Azerbaijan
-
 Bahamas
-
 Bahrain
-
 Bangladesh
-
 Belarus
-
 Belgium
-
 Bolivia
-
 Botswana
-
 Brazil
-
 Brunei
-
 Bulgaria
-
 Cambodia
-
 Cameroon
-
 Canada
-
 Chile
Chile
-
 China
China
-
 Colombia
-
 Congo
Congo
-
 Costa Rica
-
 Cote d'Ivoire
-
 Croatia
-
 Cuba
Cuba
-
 Cyprus
-
 Czechia
-
 DR Congo
-
 Denmark
-
 Dominican Republic
-
 Ecuador
-
 Egypt
Egypt
-
 El Salvador
-
 Estonia
-
 Eswatini
-
 Ethiopia
-
 Finland
-
 France
-
 Georgia
-
 Germany
-
 Ghana
Ghana
-
 Greece
-
 Haiti
Haiti
-
 Hong Kong
-
 Hungary
-
 India
India
-
 Indonesia
-
 Iran, Islamic republic
-
 Iraq
Iraq
-
 Ireland
-
 Israel
-
 Italy
Italy
-
 Jamaica
-
 Japan
Japan
-
 Jordan
-
 Kazakhstan
-
 Kenya
Kenya
-
 Korea
Korea
-
 Kuwait
-
 Kyrgyzstan
-
 Laos
Laos
-
 Latvia
-
 Lebanon
-
 Lesotho
-
 Libya
Libya
-
 Lithuania
-
 Luxembourg
-
 Madagascar
-
 Malaysia
-
 Malta
Malta
-
 Mauritius
-
 Mexico
-
 Moldova
-
 Mongolia
-
 Montenegro
-
 Morocco
-
 Mozambique
-
 Myanmar
-
 Namibia
-
 Nepal
Nepal
-
 Netherlands
-
 New Zealand
-
 Nigeria
-
 North Macedonia
-
 Norway
-
 Oman
Oman
-
 Pakistan
-
 Palestine
-
 Panama
-
 Papua New Guinea
-
 Paraguay
-
 Peru
Peru
-
 Philippines
-
 Poland
-
 Portugal
-
 Puerto Rico
-
 Qatar
Qatar
-
 Reunion
-
 Romania
-
 Rwanda
-
 Saudi Arabia
-
 Serbia
-
 Singapore
-
 Slovakia
-
 Slovenia
-
 Somalia
-
 South Africa
-
 Spain
Spain
-
 Sri Lanka
-
 Sweden
-
 Switzerland
-
 Syria
Syria
-
 Taiwan
-
 Tajikistan
-
 Tanzania
-
 Thailand
-
 Trinidad and Tobago
-
 Tunisia
-
 Turkey
-
 UAE
UAE
-
 Uganda
-
 Ukraine
-
 United Kingdom
-
United States
-
 Uruguay
-
 Uzbekistan
-
 Venezuela
-
 Vietnam
-
 Yemen
Yemen
-
 Zambia
-
 Zimbabwe
- Forex
- Crypto
