
Near: volatile trading and buyer control spark daily gain

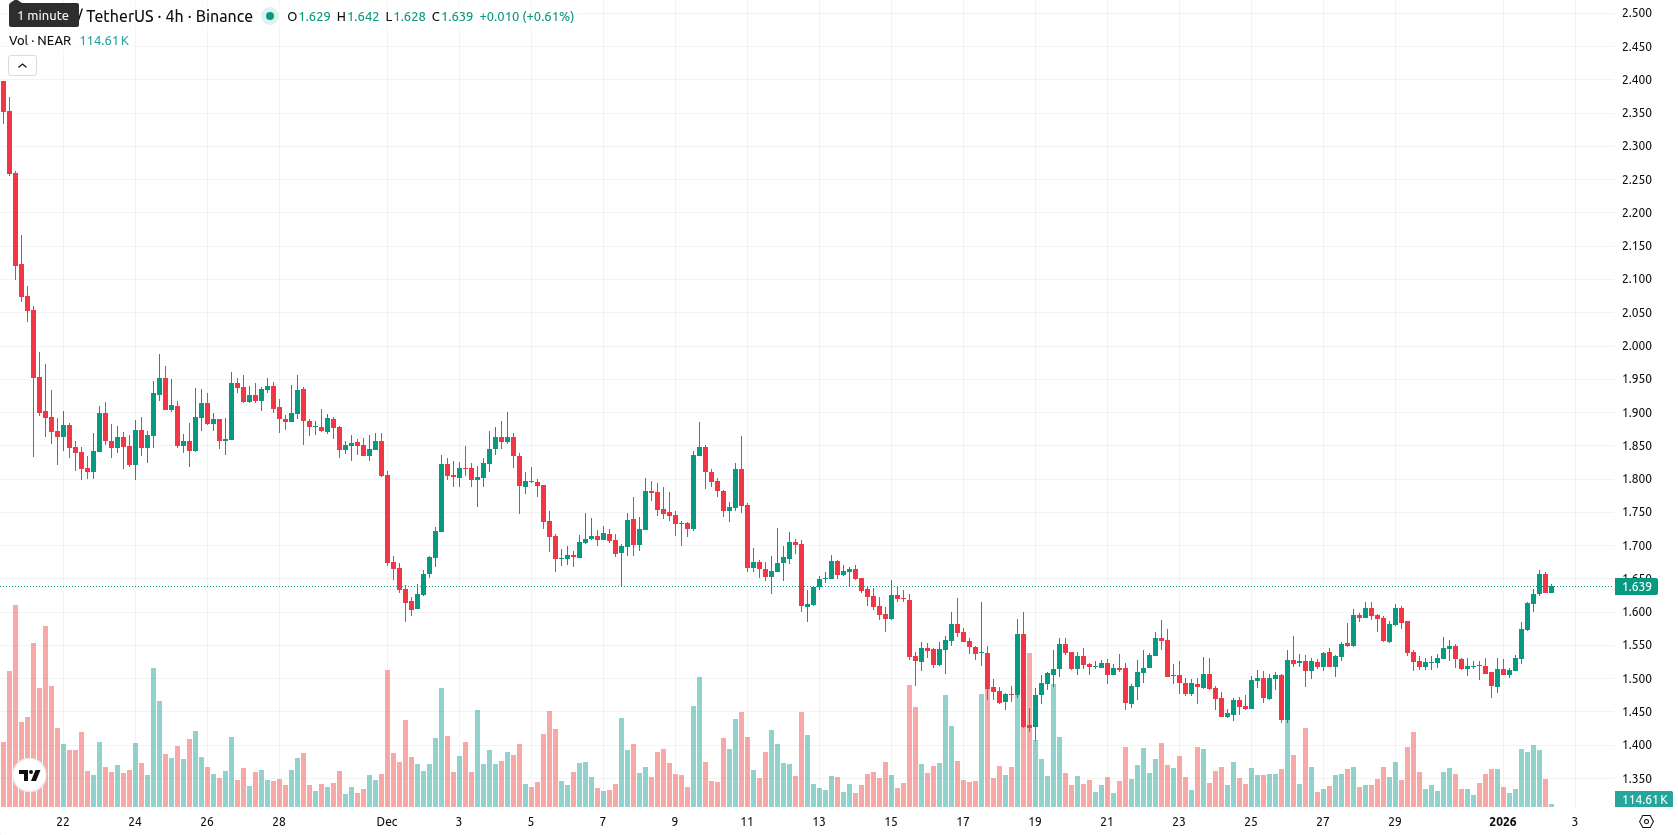
Near (NEAR) is trading at $1.6462 after a notable daily increase in both absolute and percentage terms. The price is holding above its MA-20 ($1.5306), but remains below its MA-50 ($1.7724) and MA-200 ($2.3419), indicating short-term bullishness with medium- and longer-term resistance overhead.
Highlights
- NEAR rose sharply by 8.73% intraday to $1.6462, trading above the MA-20 ($1.5306) but below the MA-50 ($1.7724), reflecting short-term bullish momentum amid medium-term resistance.
- Momentum indicators are mixed, with MACD signaling strong sell pressure while RSI and CCI suggest moderate buying; Stoch RSI is overbought, and BBP shows buyers gained intraday control.
- For the coming week, NEAR's price is projected to consolidate between $1.48 and $1.81, with less than 20% probability of a price increase and a higher likelihood of sideways or pullback movement.
Mixed momentum as buyers push toward resistance amid volatility
At the current price of $1.6462, NEAR is trading above both the MA-20 ($1.5306) and below the MA-50 ($1.7724) and MA-200 ($2.3419), indicating short-term bullish strength but lingering medium- and long-term resistance from higher moving averages. The nearest dynamic support is the D1 Ichimoku Kijun at $1.6450, while immediate resistance is expected at the MA-50 around $1.77. Momentum signals on the daily timeframe are mixed: MACD shows strong sell pressure while ADX points to a weak trend, yet RSI and CCI indicate moderate buying with no overbought conditions from RSI but a clearly overbought reading on the Stoch RSI. Bull/Bear Power (BBP) suggests buyers have gained control intraday, aligning with today’s sharp 8.73% move upward. There was a gap up at the open (from $1.514 to $1.6314), and the current price is near the high end of today’s range, reflecting high intraday volatility and strong buying momentum after the open. However, the divergence between a bearish MACD and overall bullish oscillators suggests caution, as intraday performance strongly favors bulls but underlying momentum remains fragile.
Limited upside as consolidation likely without key breakout
For the coming week, the projected price range for NEAR is between $1.48 and $1.81, reflecting a typical volatility band relative to current levels. The probability of a further price increase is low (below 20%), suggesting that a pullback or sideways movement is more likely. The baseline expectation is for the price to consolidate within this range; a sustained move above the $1.77 MA-50 is needed to signal a bullish scenario, while a drop below the Ichimoku Kijun and $1.48 support could trigger more pronounced declines.
Previously it was reported that NEAR is rebounding above its short-term moving average, but remains constrained beneath its medium- and long-term MAs, with mixed momentum signals and a volatile, range-bound pattern between support at $1.44 and resistance at $1.73. Technical indicators such as the MACD, ADX, and Bull/Bear Power point to ongoing bearish pressure, suggesting further consolidation or downside is more likely than a sustained breakout.


Latest NEAR News


-
 Afghanistan
-
 Albania
-
 Algeria
-
 Angola
-
 Argentina
-
 Armenia
-
 Australia
-
 Austria
-
 Azerbaijan
-
 Bahamas
-
 Bahrain
-
 Bangladesh
-
 Belarus
-
 Belgium
-
 Bolivia
-
 Botswana
-
 Brazil
-
 Brunei
-
 Bulgaria
-
 Cambodia
-
 Cameroon
-
 Canada
-
 Chile
Chile
-
 China
China
-
 Colombia
-
 Congo
Congo
-
 Costa Rica
-
 Cote d'Ivoire
-
 Croatia
-
 Cuba
Cuba
-
 Cyprus
-
 Czechia
-
 DR Congo
-
 Denmark
-
 Dominican Republic
-
 Ecuador
-
 Egypt
Egypt
-
 El Salvador
-
 Estonia
-
 Eswatini
-
 Ethiopia
-
 Finland
-
 France
-
 Georgia
-
 Germany
-
 Ghana
Ghana
-
 Greece
-
 Haiti
Haiti
-
 Hong Kong
-
 Hungary
-
 India
India
-
 Indonesia
-
 Iran, Islamic republic
-
 Iraq
Iraq
-
 Ireland
-
 Israel
-
 Italy
Italy
-
 Jamaica
-
 Japan
Japan
-
 Jordan
-
 Kazakhstan
-
 Kenya
Kenya
-
 Korea
Korea
-
 Kuwait
-
 Kyrgyzstan
-
 Laos
Laos
-
 Latvia
-
 Lebanon
-
 Lesotho
-
 Libya
Libya
-
 Lithuania
-
 Luxembourg
-
 Madagascar
-
 Malaysia
-
 Malta
Malta
-
 Mauritius
-
 Mexico
-
 Moldova
-
 Mongolia
-
 Montenegro
-
 Morocco
-
 Mozambique
-
 Myanmar
-
 Namibia
-
 Nepal
Nepal
-
 Netherlands
-
 New Zealand
-
 Nigeria
-
 North Macedonia
-
 Norway
-
 Oman
Oman
-
 Pakistan
-
 Palestine
-
 Panama
-
 Papua New Guinea
-
 Paraguay
-
 Peru
Peru
-
 Philippines
-
 Poland
-
 Portugal
-
 Puerto Rico
-
 Qatar
Qatar
-
 Reunion
-
 Romania
-
 Rwanda
-
 Saudi Arabia
-
 Serbia
-
 Singapore
-
 Slovakia
-
 Slovenia
-
 Somalia
-
 South Africa
-
 Spain
Spain
-
 Sri Lanka
-
 Sweden
-
 Switzerland
-
 Syria
Syria
-
 Taiwan
-
 Tajikistan
-
 Tanzania
-
 Thailand
-
 Trinidad and Tobago
-
 Tunisia
-
 Turkey
-
 UAE
UAE
-
 Uganda
-
 Ukraine
-
 United Kingdom
-
United States
-
 Uruguay
-
 Uzbekistan
-
 Venezuela
-
 Vietnam
-
 Yemen
Yemen
-
 Zambia
-
 Zimbabwe
- Forex
- Crypto
