
Raydium gains 9.34% as technicals fuel near-term bullish momentum despite overbought signals

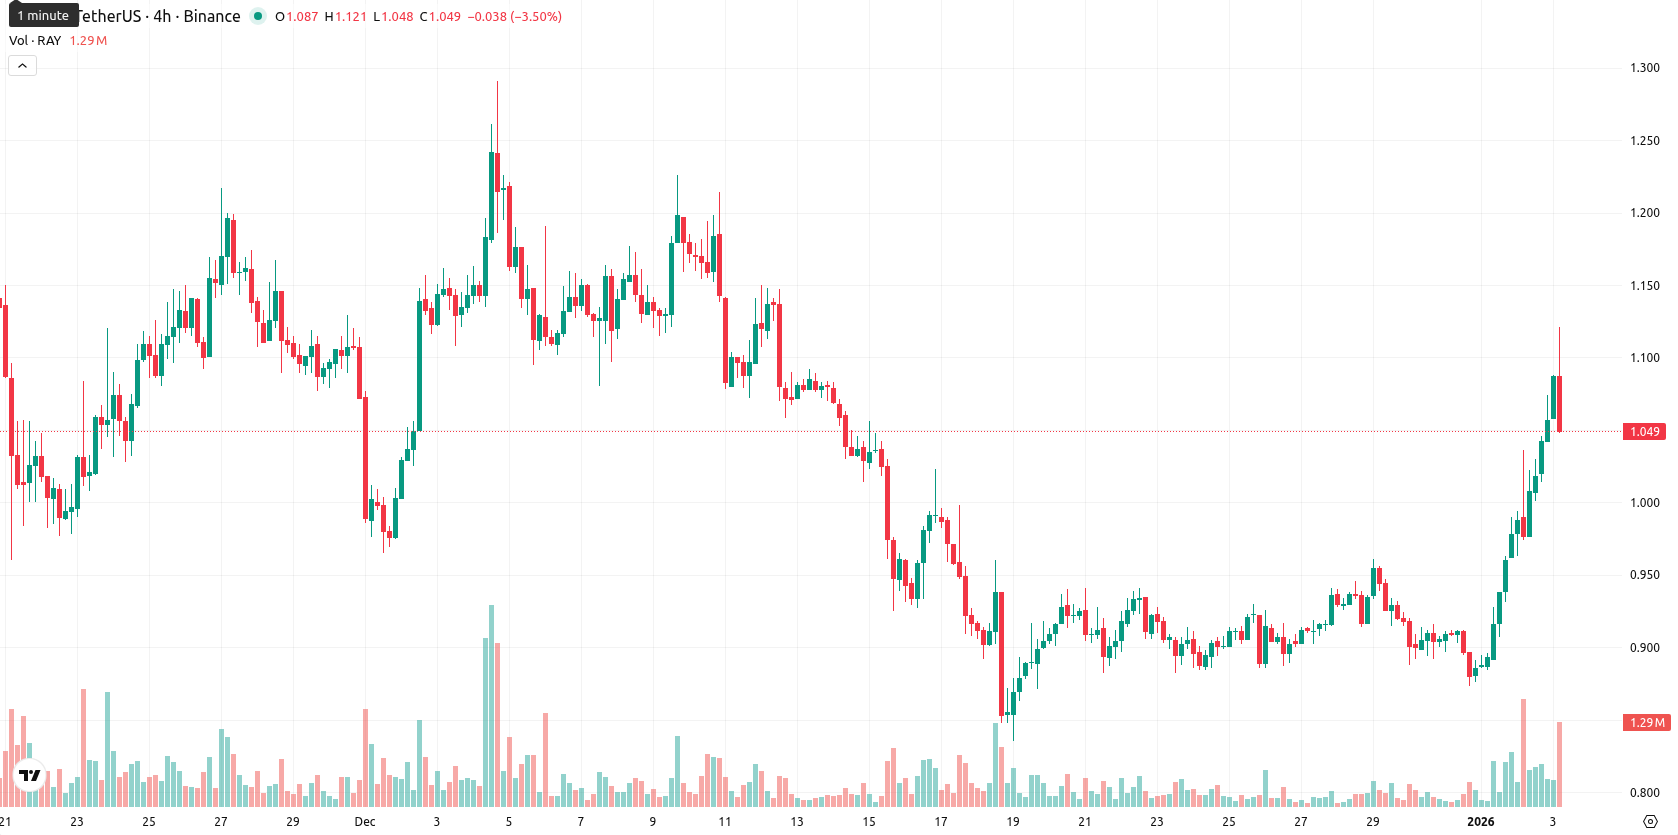
Raydium (RAY) is currently trading at $1.089, above its MA-20 ($0.9310) and MA-50 ($1.0555) but well below the long-term MA-200 ($2.2315). This positioning reflects a strong short- to medium-term bullish trend with longer-term structure still under bearish pressure, while the nearest dynamic support is at the Ichimoku Kijun level near $1.0305 and resistance is seen at MA-50 or the $1.10 – $1.12 zone.
Highlights
- RAY trades at $1.089, above its MA-20 ($0.9310) and MA-50 ($1.0555), but below the long-term MA-200 ($2.2315), reflecting short-term bullish momentum against a bearish longer-term trend.
- Despite a daily gain of 9.34% and price nearing today's high of $1.118, technical indicators like the MACD and ADX signal ongoing seller strength and elevated pullback risk due to overbought readings.
- For the next 5 trading days, RAY is expected to move sideways between $1.03 and $1.12, with a less than 20% probability of further price increase and heightened retracement risk if support at $1.03 fails.
Overbought technicals signal caution amid persistent bullish tape
Momentum indicators on the daily chart are mixed: while MACD signals strong sell and ADX points to seller strength, daily RSI is bullish and the BBP (0.1242) indicates buyers have the upper hand intraday. Both CCI and Stoch RSI are in overbought territory, signaling heightened risk of a pullback, even as the daily gain stands at 9.34% with the price near today's high after a small upward gap at the open (today’s range: $1.058 – $1.118). Intraday volatility is high, and the tape shows persistent strength toward session highs, but the divergence between overbought oscillators and bullish momentum suggests caution.
Bearish bias prevails as breakout odds diminish
For the next 5 trading days, the expected price range is $1.03 to $1.17. Based on higher-timeframe signals, the probability of further price increase is very low (less than 20%), making a decline more likely. The baseline scenario is sideways movement between $1.03 and $1.12. In a bullish scenario, a sustained push above $1.12 could lead to a test of $1.17 resistance, while a bearish scenario would see a drop below $1.03 opening room for further retracement.
Previously it was reported that Raydium is trading above its short-term MA-20, indicating brief bullish momentum, but remains below medium- and long-term moving averages, reflecting persistent downward pressure. Despite positive buyer signals and overbought oscillators, key technical indicators including the bearish MACD and elevated reversal risk suggest a consolidation phase is likely, with strong resistance near $1.03–$1.06 and support at $0.93.


-
 Afghanistan
-
 Albania
-
 Algeria
-
 Angola
-
 Argentina
-
 Armenia
-
 Australia
-
 Austria
-
 Azerbaijan
-
 Bahamas
-
 Bahrain
-
 Bangladesh
-
 Belarus
-
 Belgium
-
 Bolivia
-
 Botswana
-
 Brazil
-
 Brunei
-
 Bulgaria
-
 Cambodia
-
 Cameroon
-
 Canada
-
 Chile
Chile
-
 China
China
-
 Colombia
-
 Congo
Congo
-
 Costa Rica
-
 Cote d'Ivoire
-
 Croatia
-
 Cuba
Cuba
-
 Cyprus
-
 Czechia
-
 DR Congo
-
 Denmark
-
 Dominican Republic
-
 Ecuador
-
 Egypt
Egypt
-
 El Salvador
-
 Estonia
-
 Eswatini
-
 Ethiopia
-
 Finland
-
 France
-
 Georgia
-
 Germany
-
 Ghana
Ghana
-
 Greece
-
 Haiti
Haiti
-
 Hong Kong
-
 Hungary
-
 India
India
-
 Indonesia
-
 Iran, Islamic republic
-
 Iraq
Iraq
-
 Ireland
-
 Israel
-
 Italy
Italy
-
 Jamaica
-
 Japan
Japan
-
 Jordan
-
 Kazakhstan
-
 Kenya
Kenya
-
 Korea
Korea
-
 Kuwait
-
 Kyrgyzstan
-
 Laos
Laos
-
 Latvia
-
 Lebanon
-
 Lesotho
-
 Libya
Libya
-
 Lithuania
-
 Luxembourg
-
 Madagascar
-
 Malaysia
-
 Malta
Malta
-
 Mauritius
-
 Mexico
-
 Moldova
-
 Mongolia
-
 Montenegro
-
 Morocco
-
 Mozambique
-
 Myanmar
-
 Namibia
-
 Nepal
Nepal
-
 Netherlands
-
 New Zealand
-
 Nigeria
-
 North Macedonia
-
 Norway
-
 Oman
Oman
-
 Pakistan
-
 Palestine
-
 Panama
-
 Papua New Guinea
-
 Paraguay
-
 Peru
Peru
-
 Philippines
-
 Poland
-
 Portugal
-
 Puerto Rico
-
 Qatar
Qatar
-
 Reunion
-
 Romania
-
 Rwanda
-
 Saudi Arabia
-
 Serbia
-
 Singapore
-
 Slovakia
-
 Slovenia
-
 Somalia
-
 South Africa
-
 Spain
Spain
-
 Sri Lanka
-
 Sweden
-
 Switzerland
-
 Syria
Syria
-
 Taiwan
-
 Tajikistan
-
 Tanzania
-
 Thailand
-
 Trinidad and Tobago
-
 Tunisia
-
 Turkey
-
 UAE
UAE
-
 Uganda
-
 Ukraine
-
 United Kingdom
-
United States
-
 Uruguay
-
 Uzbekistan
-
 Venezuela
-
 Vietnam
-
 Yemen
Yemen
-
 Zambia
-
 Zimbabwe
- Forex
- Crypto
