

Raydium (RAY) is trading at $0.6784 after a drop of 7.83% over the last 24 hours. The asset remains below its key moving averages, reflecting ongoing downward momentum.
 0.715
0.7579
0.715
0.7579
Highlights
- RAY/USD faces persistent bearish momentum, trading below key moving averages across all major timeframes.
- Multiple momentum and volatility indicators confirm strong intraday selling with oversold technical conditions prevailing.
- Price is forecast to consolidate in a $0.6516–$0.7912 range, with high probability of further downside and limited reversal potential.
Oversold signals persist as technical barriers reinforce bearish momentum
On the technical front, RAY/USD is positioned below the MA-20 at $0.7164 and MA-50 at $0.7245 on the H1 chart, as well as beneath the long-term MA-200 at $0.7395 on the daily timeframe. The Ichimoku Kijun, set at $0.7151, marks the nearest resistance level. Momentum studies are weak: the Moving Average Convergence Divergence (MACD) and Average Directional Index (ADX) both continue to show a sell bias. Relative Strength Index (RSI) sits at 21.58, signaling oversold conditions, and this is echoed by both the Stochastic RSI and Commodity Channel Index (CCI). Bull/Bear Power remains on sell, affirming aggressive selling pressure for the session, while the Awesome Oscillator is neutral despite high volatility. No divergence is apparent among oscillators and momentum indicators, supporting the persistence of current bearish momentum.
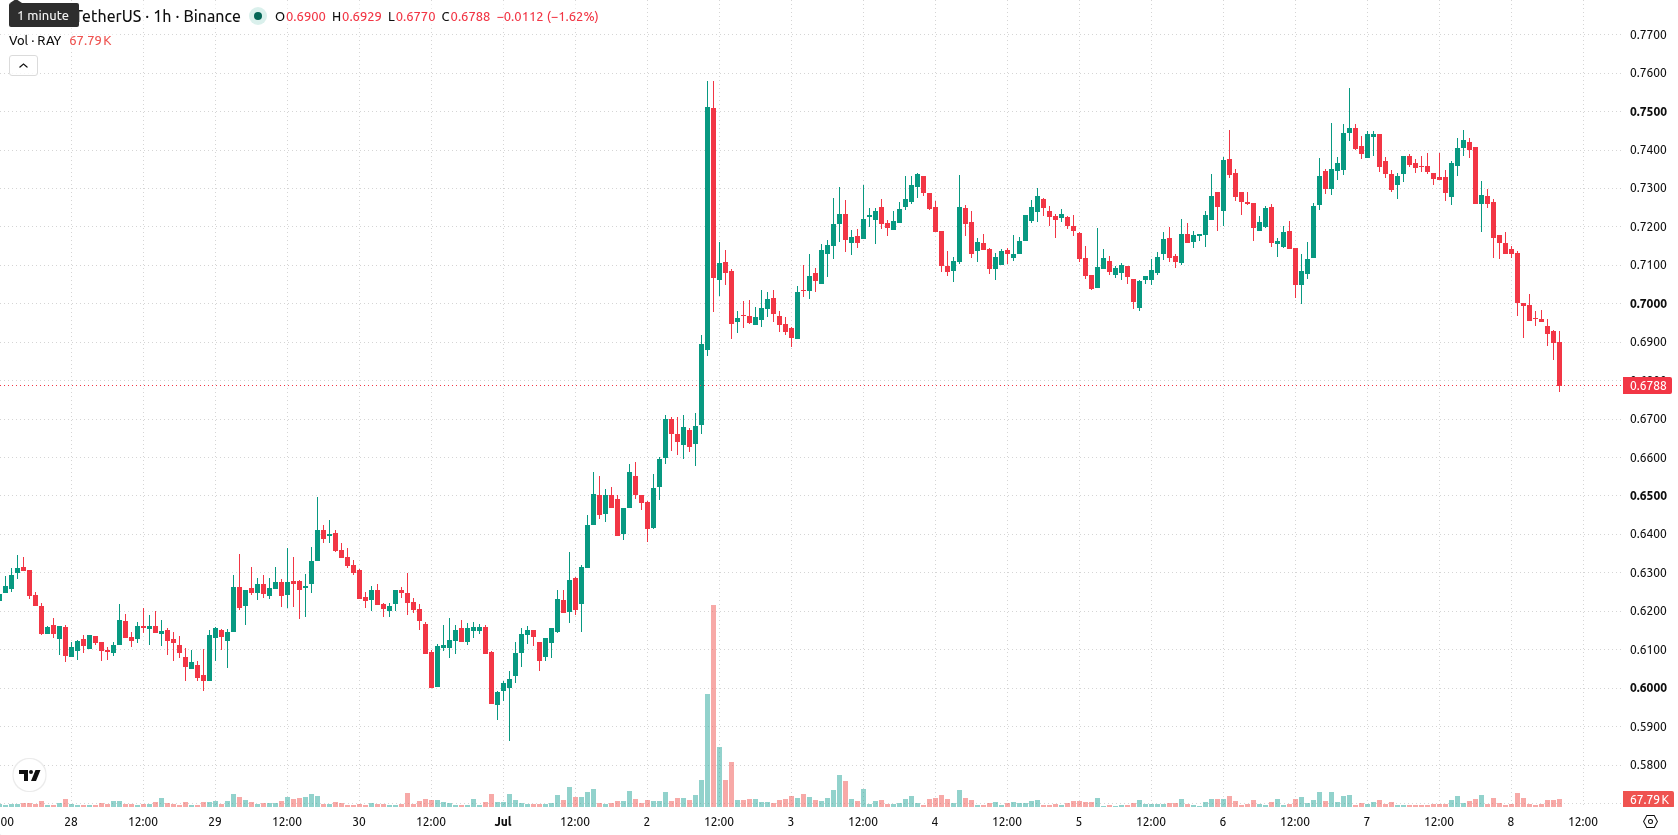
Downside risk rises with low chance of near-term reversal
Looking ahead over the next 2–3 trading days, the forecasted range stands between $0.6516 and $0.7912. Downside risk is elevated and the probability of a reversal is considered low. The base scenario envisions RAY consolidating within this band. A move above immediate resistance would be needed to trigger a bullish scenario, whereas further losses may occur if price slips under the lower end of the projected corridor.
Earlier, analysts noted that Raydium exhibited short-term bullish momentum but faced significant resistance risks. The latest developments mark a clear shift to sustained bearish pressure, making continued downside likely unless the asset can reclaim its key moving averages in the near term.














-
 Afghanistan
-
 Albania
-
 Algeria
-
 Angola
-
 Argentina
-
 Armenia
-
 Australia
-
 Austria
-
 Azerbaijan
-
 Bahamas
-
 Bahrain
-
 Bangladesh
-
 Belarus
-
 Belgium
-
 Bolivia
-
 Botswana
-
 Brazil
-
 Brunei
-
 Bulgaria
-
 Cambodia
-
 Cameroon
-
 Canada
-
 Chile
Chile
-
 China
China
-
 Colombia
-
 Congo
Congo
-
 Costa Rica
-
 Cote d'Ivoire
-
 Croatia
-
 Cuba
Cuba
-
 Cyprus
-
 Czechia
-
 DR Congo
-
 Denmark
-
 Dominican Republic
-
 Ecuador
-
 Egypt
Egypt
-
 El Salvador
-
 Estonia
-
 Eswatini
-
 Ethiopia
-
 Finland
-
 France
-
 Georgia
-
 Germany
-
 Ghana
Ghana
-
 Greece
-
 Haiti
Haiti
-
 Hong Kong
-
 Hungary
-
 India
India
-
 Indonesia
-
 Iran, Islamic republic
-
 Iraq
Iraq
-
 Ireland
-
 Israel
-
 Italy
Italy
-
 Jamaica
-
 Japan
Japan
-
 Jordan
-
 Kazakhstan
-
 Kenya
Kenya
-
 Korea
Korea
-
 Kuwait
-
 Kyrgyzstan
-
 Laos
Laos
-
 Latvia
-
 Lebanon
-
 Lesotho
-
 Libya
Libya
-
 Lithuania
-
 Luxembourg
-
 Madagascar
-
 Malaysia
-
 Malta
Malta
-
 Mauritius
-
 Mexico
-
 Moldova
-
 Mongolia
-
 Montenegro
-
 Morocco
-
 Mozambique
-
 Myanmar
-
 Namibia
-
 Nepal
Nepal
-
 Netherlands
-
 New Zealand
-
 Nigeria
-
 North Macedonia
-
 Norway
-
 Oman
Oman
-
 Pakistan
-
 Palestine
-
 Panama
-
 Papua New Guinea
-
 Paraguay
-
 Peru
Peru
-
 Philippines
-
 Poland
-
 Portugal
-
 Puerto Rico
-
 Qatar
Qatar
-
 Reunion
-
 Romania
-
 Rwanda
-
 Saudi Arabia
-
 Serbia
-
 Singapore
-
 Slovakia
-
 Slovenia
-
 Somalia
-
 South Africa
-
 Spain
Spain
-
 Sri Lanka
-
 Sweden
-
 Switzerland
-
 Syria
Syria
-
 Taiwan
-
 Tajikistan
-
 Tanzania
-
 Thailand
-
 Trinidad and Tobago
-
 Tunisia
-
 Turkey
-
 UAE
UAE
-
 Uganda
-
 Ukraine
-
 United Kingdom
-
United States
-
 Uruguay
-
 Uzbekistan
-
 Venezuela
-
 Vietnam
-
 Yemen
Yemen
-
 Zambia
-
 Zimbabwe
- Forex
- Crypto











