
Sonic: Buyer strength fuels rally despite overbought warnings and consolidation risks

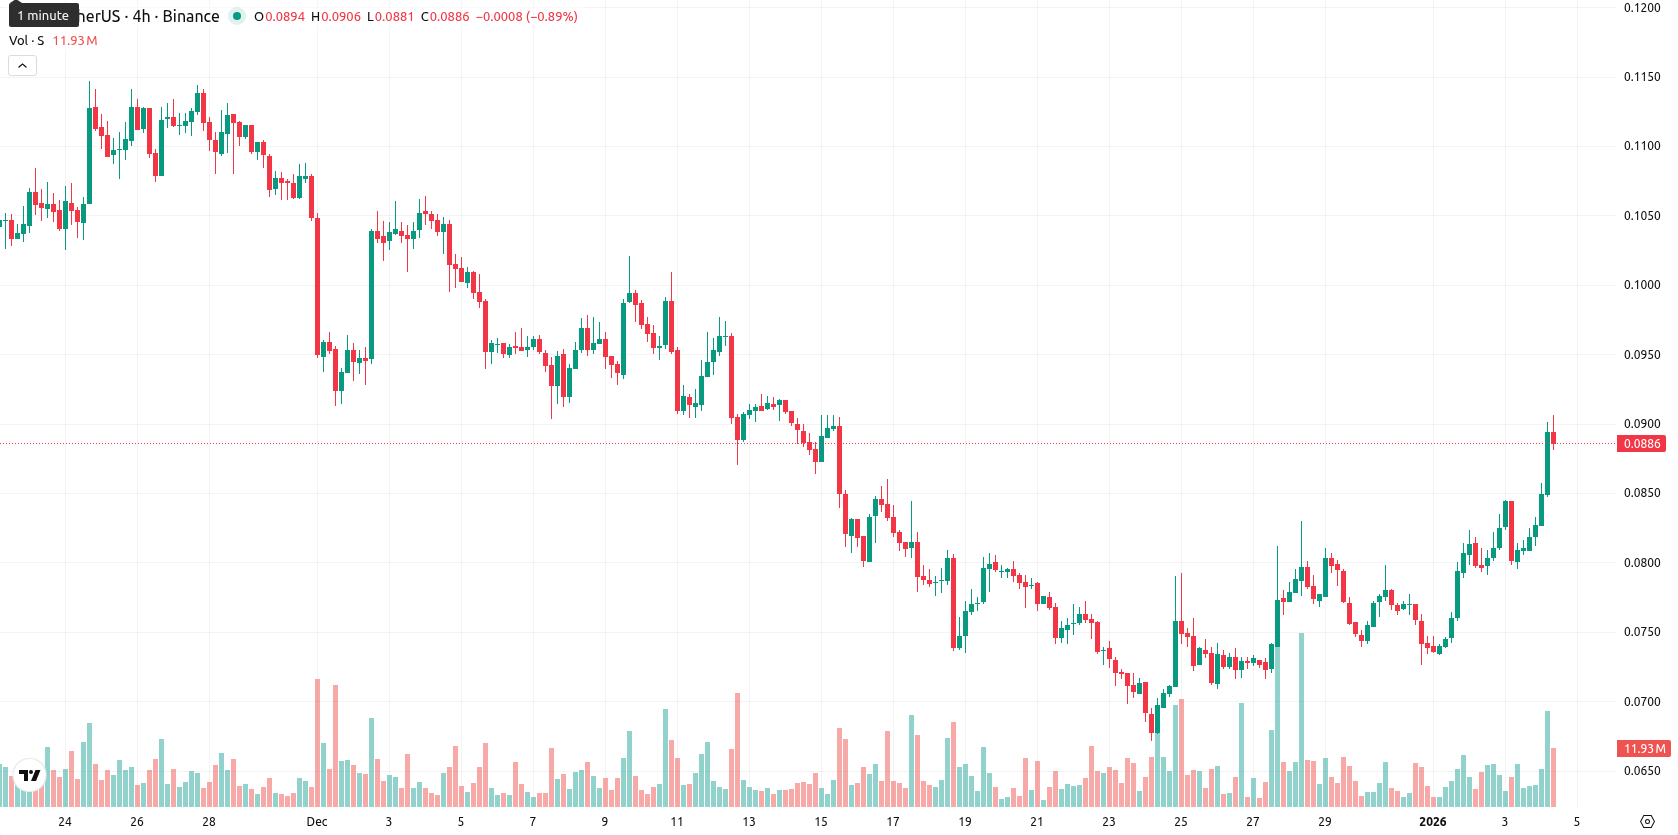
Sonic (S, formerly Fantom) is currently trading at $0.0883, which places it above both the MA-20 ($0.0773) and below the MA-50 ($0.0942), with the MA-200 much higher at $0.2292. This setup indicates a short-term bullish bias with upward momentum in the near term but ongoing medium- and long-term resistance, and Ichimoku’s Kijun at $0.0846 acts as the nearest dynamic support while the MA-50 remains the closest resistance.
Highlights
- Sonic (S) surged 7.42% intraday to $0.0883, trading above its MA-20 ($0.0773) but below MA-50 ($0.0942), signaling near-term bullish but medium-term resistance.
- Momentum indicators show mixed signals, with intraday buyer dominance contradicting neutral to bearish D1 MACD and RSI, and both Stoch RSI and CCI flagging overbought conditions.
- Over the next 5 days, price is expected to consolidate between $0.0800 and $0.0940, with downside risk prevailing due to dominant weekly sell signals.
Intraday surge diverges from caution in momentum indicators
Momentum indicators are showing mixed signals: the D1 MACD signals strong sell while the ADX hints at a directional decline, yet the BBP points to buyer dominance and intraday pressure is upward. Oscillators are flashing caution: the D1 RSI and MACD indicate neutral to bearish momentum, while both Stoch RSI (overbought at 100) and CCI are signaling overbought conditions. After a small upward gap (yesterday’s close at $0.0822, today’s open at $0.0827) the price surged 7.42% intraday, currently trading near today’s high with high volatility, highlighting strong buyer interest and sustained upward tone through the session. These strong intraday gains stand in contrast to momentum and oscillator-based caution, underscoring a clear divergence between short-term price action and underlying trend signals.
Downside risk prevails as sell signals outweigh bullish potential
Looking ahead to the next 5 trading days, a price range of $0.0800 to $0.0940 represents the typical volatility band relative to current levels, maintaining the current sideways-to-slightly-bullish tone. The probability of another price increase is very low (less than 20%), making further downside more likely given prevailing weekly momentum and the dominance of sell signals in W1 MACD and RSI. The baseline scenario sees consolidation within this band, the bullish case would require a break above $0.0940 (MA-50) to unlock higher levels, and the bearish case is a drop below $0.0846 (Kijun support), which could open the way to deeper retracement.
Last time, analysts noted that Sonic (S) is trading above its short-term moving average but remains well below key medium- and long-term averages, signaling a short-term recovery within a broader bearish trend. Technical signals are mixed with support at $0.0779 and resistance at $0.0846, as buying pressure faces persistent selling and the outlook favors continued consolidation with downside risk.


-
 Afghanistan
-
 Albania
-
 Algeria
-
 Angola
-
 Argentina
-
 Armenia
-
 Australia
-
 Austria
-
 Azerbaijan
-
 Bahamas
-
 Bahrain
-
 Bangladesh
-
 Belarus
-
 Belgium
-
 Bolivia
-
 Botswana
-
 Brazil
-
 Brunei
-
 Bulgaria
-
 Cambodia
-
 Cameroon
-
 Canada
-
 Chile
Chile
-
 China
China
-
 Colombia
-
 Congo
Congo
-
 Costa Rica
-
 Cote d'Ivoire
-
 Croatia
-
 Cuba
Cuba
-
 Cyprus
-
 Czechia
-
 DR Congo
-
 Denmark
-
 Dominican Republic
-
 Ecuador
-
 Egypt
Egypt
-
 El Salvador
-
 Estonia
-
 Eswatini
-
 Ethiopia
-
 Finland
-
 France
-
 Georgia
-
 Germany
-
 Ghana
Ghana
-
 Greece
-
 Haiti
Haiti
-
 Hong Kong
-
 Hungary
-
 India
India
-
 Indonesia
-
 Iran, Islamic republic
-
 Iraq
Iraq
-
 Ireland
-
 Israel
-
 Italy
Italy
-
 Jamaica
-
 Japan
Japan
-
 Jordan
-
 Kazakhstan
-
 Kenya
Kenya
-
 Korea
Korea
-
 Kuwait
-
 Kyrgyzstan
-
 Laos
Laos
-
 Latvia
-
 Lebanon
-
 Lesotho
-
 Libya
Libya
-
 Lithuania
-
 Luxembourg
-
 Madagascar
-
 Malaysia
-
 Malta
Malta
-
 Mauritius
-
 Mexico
-
 Moldova
-
 Mongolia
-
 Montenegro
-
 Morocco
-
 Mozambique
-
 Myanmar
-
 Namibia
-
 Nepal
Nepal
-
 Netherlands
-
 New Zealand
-
 Nigeria
-
 North Macedonia
-
 Norway
-
 Oman
Oman
-
 Pakistan
-
 Palestine
-
 Panama
-
 Papua New Guinea
-
 Paraguay
-
 Peru
Peru
-
 Philippines
-
 Poland
-
 Portugal
-
 Puerto Rico
-
 Qatar
Qatar
-
 Reunion
-
 Romania
-
 Rwanda
-
 Saudi Arabia
-
 Serbia
-
 Singapore
-
 Slovakia
-
 Slovenia
-
 Somalia
-
 South Africa
-
 Spain
Spain
-
 Sri Lanka
-
 Sweden
-
 Switzerland
-
 Syria
Syria
-
 Taiwan
-
 Tajikistan
-
 Tanzania
-
 Thailand
-
 Trinidad and Tobago
-
 Tunisia
-
 Turkey
-
 UAE
UAE
-
 Uganda
-
 Ukraine
-
 United Kingdom
-
United States
-
 Uruguay
-
 Uzbekistan
-
 Venezuela
-
 Vietnam
-
 Yemen
Yemen
-
 Zambia
-
 Zimbabwe
- Forex
- Crypto
