
+7.69% for Immutable X — buyers dominate despite overbought signals, resistance nears

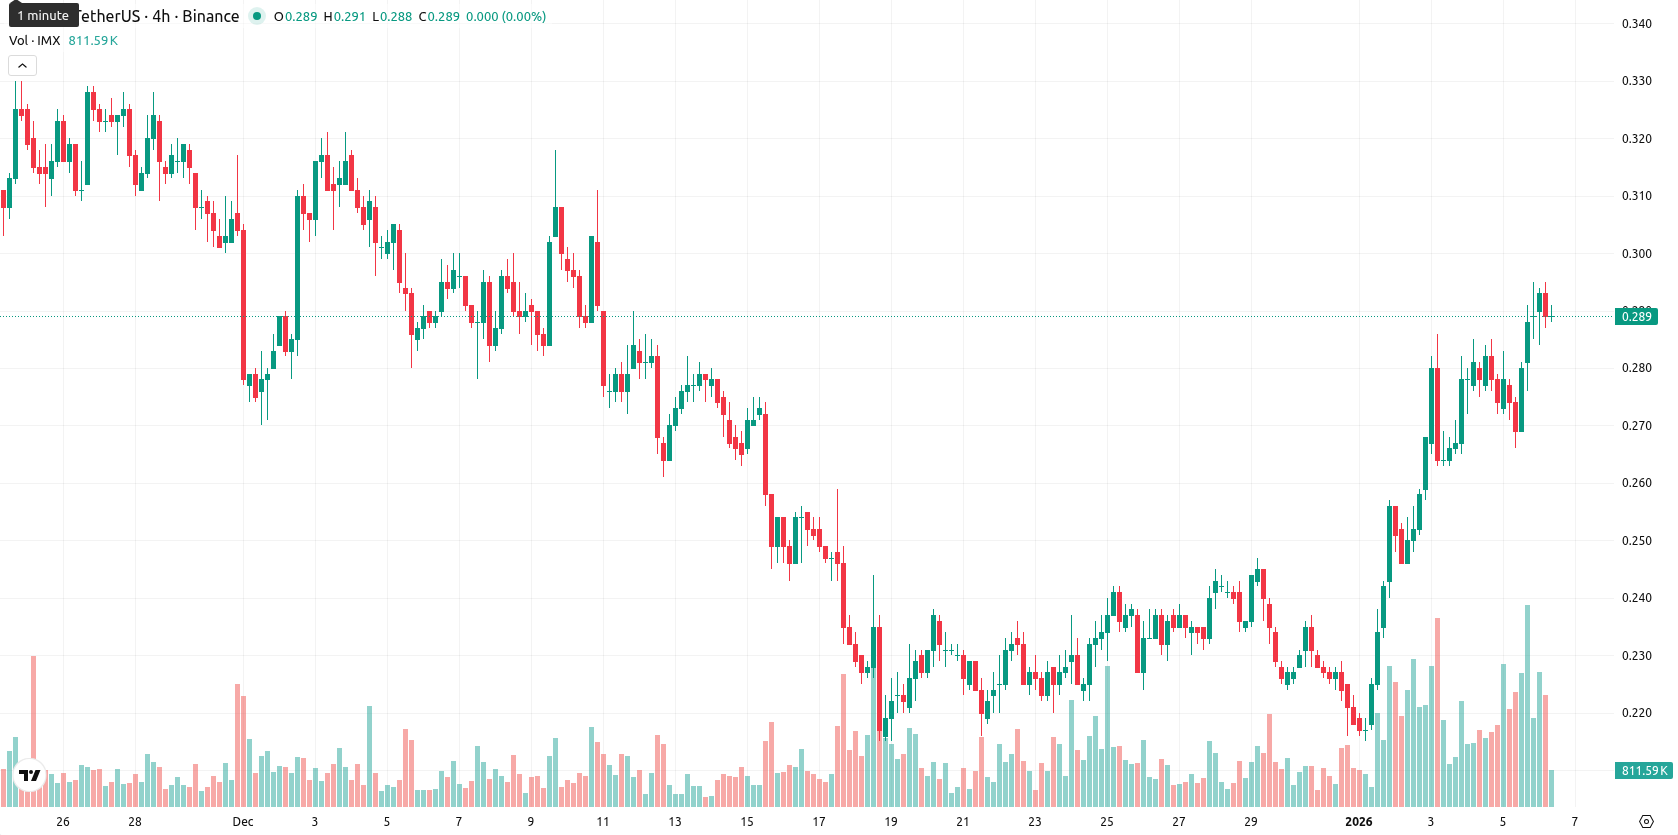
Immutable X (IMX) is trading at $0.294, above both the MA-20 ($0.2399) and MA-50 ($0.2793) but well below the long-term MA-200 ($0.4822). This suggests short- and medium-term momentum remains bullish, while long-term sentiment continues under seller pressure, with $0.2793 and the Ichimoku Kijun at $0.2550 now acting as dynamic support and the next resistance zone likely forming near the recent highs.
 0.1279
0.1347
0.1279
0.1347
Highlights
- IMX is trading at $0.294, above the MA-20 ($0.2399) and MA-50 ($0.2793), but remains well below the MA-200 ($0.4822), indicating bullish short-term momentum amid long-term selling pressure.
- Momentum indicators such as ADX (27.94) and RSI (60.8) show strong buyer activity, but overbought signals from CCI (205.87) and Stoch RSI (100) suggest limited further upside without consolidation.
- For the next five trading days, IMX is expected to consolidate between $0.284 and $0.295, with less than 20% probability of further price increases and increased risk of a downside correction if $0.284 support fails.
Overbought risks emerge as intraday buyers drive price higher
Momentum signals show a mixed but mostly positive tone for bulls: the daily ADX (27.94) and RSI (60.8) imply active trend strength and persistent buyer interest, while the MACD is neutral and the daily CCI (205.87) and Stoch RSI (100) point to an overbought condition. Bull/Bear Power indicates buyers remain in control intraday, and the Awesome Oscillator supports the bullish trend. The current price is near the top of today’s range ($0.284 – $0.295), with no gap between prior close ($0.273) and today’s open ($0.29), showing strong upside momentum and moderately high intraday volatility as price pushes toward the highs. However, the presence of overbought oscillators alongside persistent momentum signals reflects a divergence that may limit further upside without a consolidation.
Downside favored short term as weekly trend indicators turn negative
For the next five trading days, the expected range is $0.284 to $0.295, keeping price action clustered near recent levels. The probability of further price increases is very low (less than 20%), making a move lower the more likely short-term scenario based on weekly trends, where all major indicators (RSI, ADX, MACD, MA-50) point downward. The baseline scenario sees IMX consolidating between $0.284 and $0.295. A bullish outcome would require a firm breakout and daily close above $0.295, targeting new resistance levels. Conversely, if support at $0.284 fails, a correction toward the Ichimoku Kijun or lower is possible.
Previously it was reported that Immutable X is showing short-term upside momentum above its 20-day moving average but remains under medium- and long-term bearish pressure beneath the 50-day and 200-day moving averages, with dynamic support at the Ichimoku Kijun and resistance at the MA-50. Momentum indicators are mixed—MACD remains bearish while RSI is modestly bullish and overbought oscillators flag caution—implying that the recent intraday rally lacks robust underlying support and is likely to be followed by sideways price consolidation within a limited range.


Latest IMX News






-
 Afghanistan
-
 Albania
-
 Algeria
-
 Angola
-
 Argentina
-
 Armenia
-
 Australia
-
 Austria
-
 Azerbaijan
-
 Bahamas
-
 Bahrain
-
 Bangladesh
-
 Belarus
-
 Belgium
-
 Bolivia
-
 Botswana
-
 Brazil
-
 Brunei
-
 Bulgaria
-
 Cambodia
-
 Cameroon
-
 Canada
-
 Chile
Chile
-
 China
China
-
 Colombia
-
 Congo
Congo
-
 Costa Rica
-
 Cote d'Ivoire
-
 Croatia
-
 Cuba
Cuba
-
 Cyprus
-
 Czechia
-
 DR Congo
-
 Denmark
-
 Dominican Republic
-
 Ecuador
-
 Egypt
Egypt
-
 El Salvador
-
 Estonia
-
 Eswatini
-
 Ethiopia
-
 Finland
-
 France
-
 Georgia
-
 Germany
-
 Ghana
Ghana
-
 Greece
-
 Haiti
Haiti
-
 Hong Kong
-
 Hungary
-
 India
India
-
 Indonesia
-
 Iran, Islamic republic
-
 Iraq
Iraq
-
 Ireland
-
 Israel
-
 Italy
Italy
-
 Jamaica
-
 Japan
Japan
-
 Jordan
-
 Kazakhstan
-
 Kenya
Kenya
-
 Korea
Korea
-
 Kuwait
-
 Kyrgyzstan
-
 Laos
Laos
-
 Latvia
-
 Lebanon
-
 Lesotho
-
 Libya
Libya
-
 Lithuania
-
 Luxembourg
-
 Madagascar
-
 Malaysia
-
 Malta
Malta
-
 Mauritius
-
 Mexico
-
 Moldova
-
 Mongolia
-
 Montenegro
-
 Morocco
-
 Mozambique
-
 Myanmar
-
 Namibia
-
 Nepal
Nepal
-
 Netherlands
-
 New Zealand
-
 Nigeria
-
 North Macedonia
-
 Norway
-
 Oman
Oman
-
 Pakistan
-
 Palestine
-
 Panama
-
 Papua New Guinea
-
 Paraguay
-
 Peru
Peru
-
 Philippines
-
 Poland
-
 Portugal
-
 Puerto Rico
-
 Qatar
Qatar
-
 Reunion
-
 Romania
-
 Rwanda
-
 Saudi Arabia
-
 Serbia
-
 Singapore
-
 Slovakia
-
 Slovenia
-
 Somalia
-
 South Africa
-
 Spain
Spain
-
 Sri Lanka
-
 Sweden
-
 Switzerland
-
 Syria
Syria
-
 Taiwan
-
 Tajikistan
-
 Tanzania
-
 Thailand
-
 Trinidad and Tobago
-
 Tunisia
-
 Turkey
-
 UAE
UAE
-
 Uganda
-
 Ukraine
-
 United Kingdom
-
United States
-
 Uruguay
-
 Uzbekistan
-
 Venezuela
-
 Vietnam
-
 Yemen
Yemen
-
 Zambia
-
 Zimbabwe
- Forex
- Crypto











