
Gala price prediction: More upside ahead or reversal imminent? GALA gains 7.31%

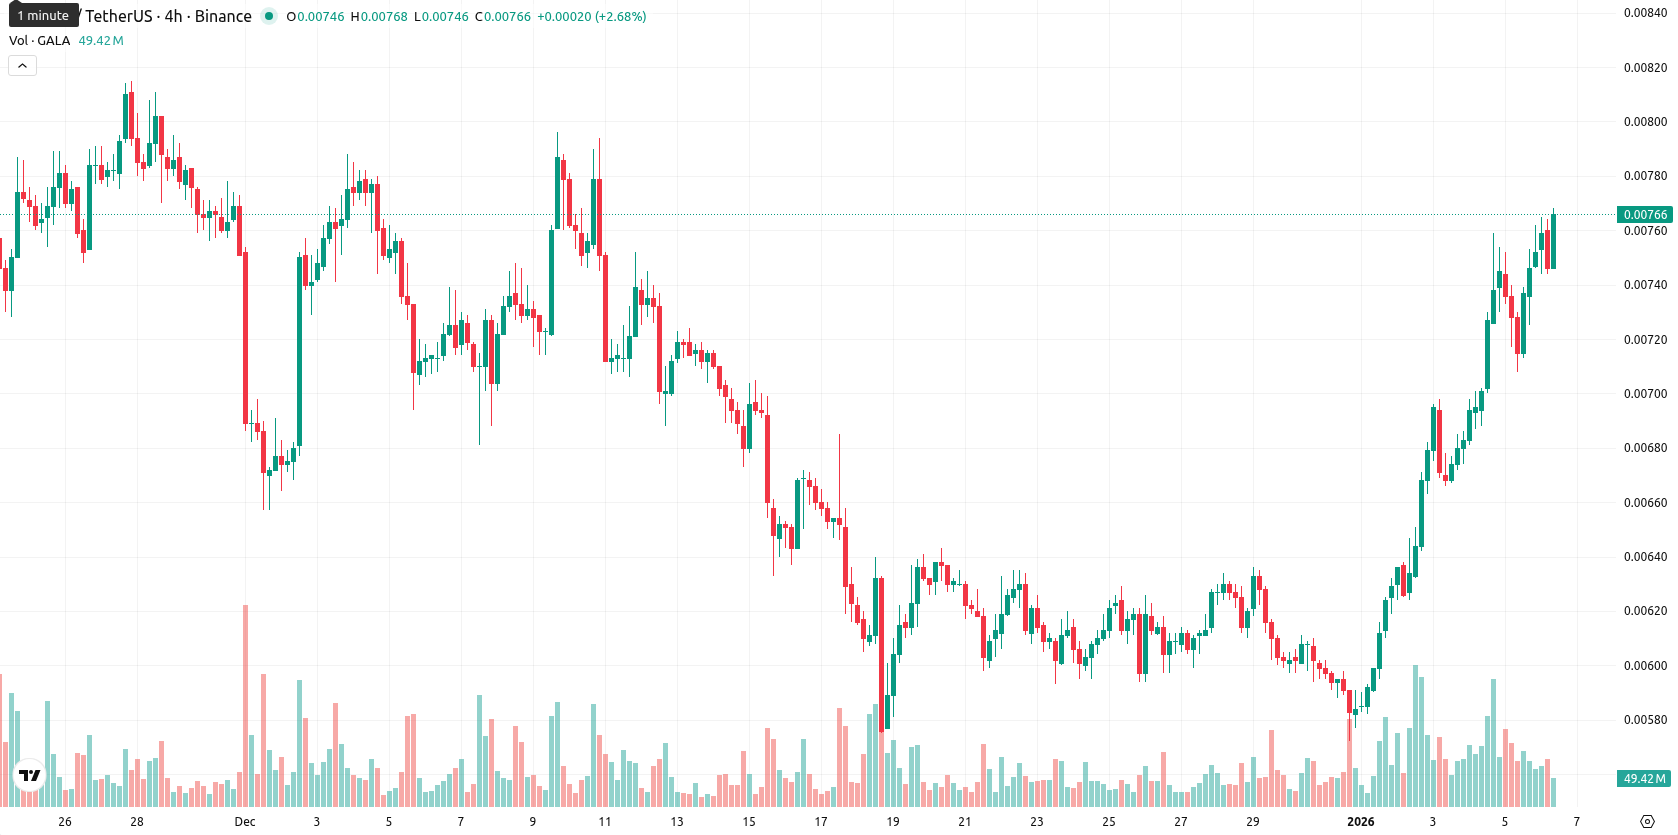
Gala (GALA) is currently trading at $0.00763, which is above both its MA-20 ($0.00633150) and MA-50 ($0.00703640) but remains well below the long-term MA-200 ($0.01283920), suggesting short- and medium-term bullish momentum while long-term resistance lingers. Today’s session shows a strong intraday move, gaining 7.31% from the previous close, opening slightly higher with no significant gap.
 0.002048
0.00219100
0.002048
0.00219100
Highlights
- Gala has expanded its presence in the crypto gaming sector through new blockchain-powered games and partnerships with established game developers.
- The play-to-earn reward model remains the main method for users to earn GALA, driving increased participation from both gamers and cryptocurrency users.
- No recent regulatory or tokenomic changes have been reported for Gala, indicating continued operational stability within its gaming ecosystem.
New gaming partnerships drive sector footprint amid steady tokenomics
Recent updates indicate that Gala continues to expand its footprint within the crypto gaming sector, with new blockchain-powered games and partnerships with established game developers. The unique play-to-earn reward model remains the primary way users earn GALA, underpinning its growing appeal among gamers and cryptocurrency participants. No regulatory or tokenomic changes have been reported lately.
Overbought signals flag risks as buyers push toward resistance
The nearest dynamic support is the Ichimoku Kijun at $0.00667, while immediate resistance levels are found at the MA-50 and the $0.00770 round level. Momentum signals are mixed: the MACD reads neutral while the D1 ADX indicates strong trend strength but with a selling bias. RSI at 63.95 points to sustained buying, but both Stoch RSI and CCI are overbought, warning of short-term exhaustion. BBP confirms intraday buyer dominance, and the Awesome Oscillator supports the prevailing upward trend. The price is trading near today’s high ($0.00765), intraday volatility is moderate, and there is clear strength toward the highs. However, the combination of overbought oscillators and strong buyer momentum signals short-term divergence and necessitates caution if momentum weakens.
Consolidation likely as bearish signals outweigh upside potential
For the coming week, the expected trading range is $0.00763 to $0.00771, closely centered around the current price. The probability of a further price increase is very low (less than 20%) based on the predominance of bearish weekly signals, making a downside move more likely. Baseline scenario: price consolidates in a tight corridor just below resistance. Bullish scenario: a break above $0.00770 could trigger short covering, but upside appears limited. Bearish scenario: a slip below the $0.00667 support would confirm waning momentum and could push GALA further down into previous congestion zones.
Previously it was reported that Gala (GALA) is exhibiting short-term bullish momentum, trading above its 20- and 50-day moving averages but remaining under long-term bearish pressure beneath the 200-day MA, with immediate support at the Ichimoku Kijun and resistance at the 50-day MA. However, daily momentum and oscillator signals are diverging—MACD and ADX indicate downward pressure while RSI and Stoch RSI suggest overbought conditions—highlighting heightened volatility, strong buying activity, and a low probability of a sustained upward breakout.









-
 Afghanistan
-
 Albania
-
 Algeria
-
 Angola
-
 Argentina
-
 Armenia
-
 Australia
-
 Austria
-
 Azerbaijan
-
 Bahamas
-
 Bahrain
-
 Bangladesh
-
 Belarus
-
 Belgium
-
 Bolivia
-
 Botswana
-
 Brazil
-
 Brunei
-
 Bulgaria
-
 Cambodia
-
 Cameroon
-
 Canada
-
 Chile
Chile
-
 China
China
-
 Colombia
-
 Congo
Congo
-
 Costa Rica
-
 Cote d'Ivoire
-
 Croatia
-
 Cuba
Cuba
-
 Cyprus
-
 Czechia
-
 DR Congo
-
 Denmark
-
 Dominican Republic
-
 Ecuador
-
 Egypt
Egypt
-
 El Salvador
-
 Estonia
-
 Eswatini
-
 Ethiopia
-
 Finland
-
 France
-
 Georgia
-
 Germany
-
 Ghana
Ghana
-
 Greece
-
 Haiti
Haiti
-
 Hong Kong
-
 Hungary
-
 India
India
-
 Indonesia
-
 Iran, Islamic republic
-
 Iraq
Iraq
-
 Ireland
-
 Israel
-
 Italy
Italy
-
 Jamaica
-
 Japan
Japan
-
 Jordan
-
 Kazakhstan
-
 Kenya
Kenya
-
 Korea
Korea
-
 Kuwait
-
 Kyrgyzstan
-
 Laos
Laos
-
 Latvia
-
 Lebanon
-
 Lesotho
-
 Libya
Libya
-
 Lithuania
-
 Luxembourg
-
 Madagascar
-
 Malaysia
-
 Malta
Malta
-
 Mauritius
-
 Mexico
-
 Moldova
-
 Mongolia
-
 Montenegro
-
 Morocco
-
 Mozambique
-
 Myanmar
-
 Namibia
-
 Nepal
Nepal
-
 Netherlands
-
 New Zealand
-
 Nigeria
-
 North Macedonia
-
 Norway
-
 Oman
Oman
-
 Pakistan
-
 Palestine
-
 Panama
-
 Papua New Guinea
-
 Paraguay
-
 Peru
Peru
-
 Philippines
-
 Poland
-
 Portugal
-
 Puerto Rico
-
 Qatar
Qatar
-
 Reunion
-
 Romania
-
 Rwanda
-
 Saudi Arabia
-
 Serbia
-
 Singapore
-
 Slovakia
-
 Slovenia
-
 Somalia
-
 South Africa
-
 Spain
Spain
-
 Sri Lanka
-
 Sweden
-
 Switzerland
-
 Syria
Syria
-
 Taiwan
-
 Tajikistan
-
 Tanzania
-
 Thailand
-
 Trinidad and Tobago
-
 Tunisia
-
 Turkey
-
 UAE
UAE
-
 Uganda
-
 Ukraine
-
 United Kingdom
-
United States
-
 Uruguay
-
 Uzbekistan
-
 Venezuela
-
 Vietnam
-
 Yemen
Yemen
-
 Zambia
-
 Zimbabwe
- Forex
- Crypto











