
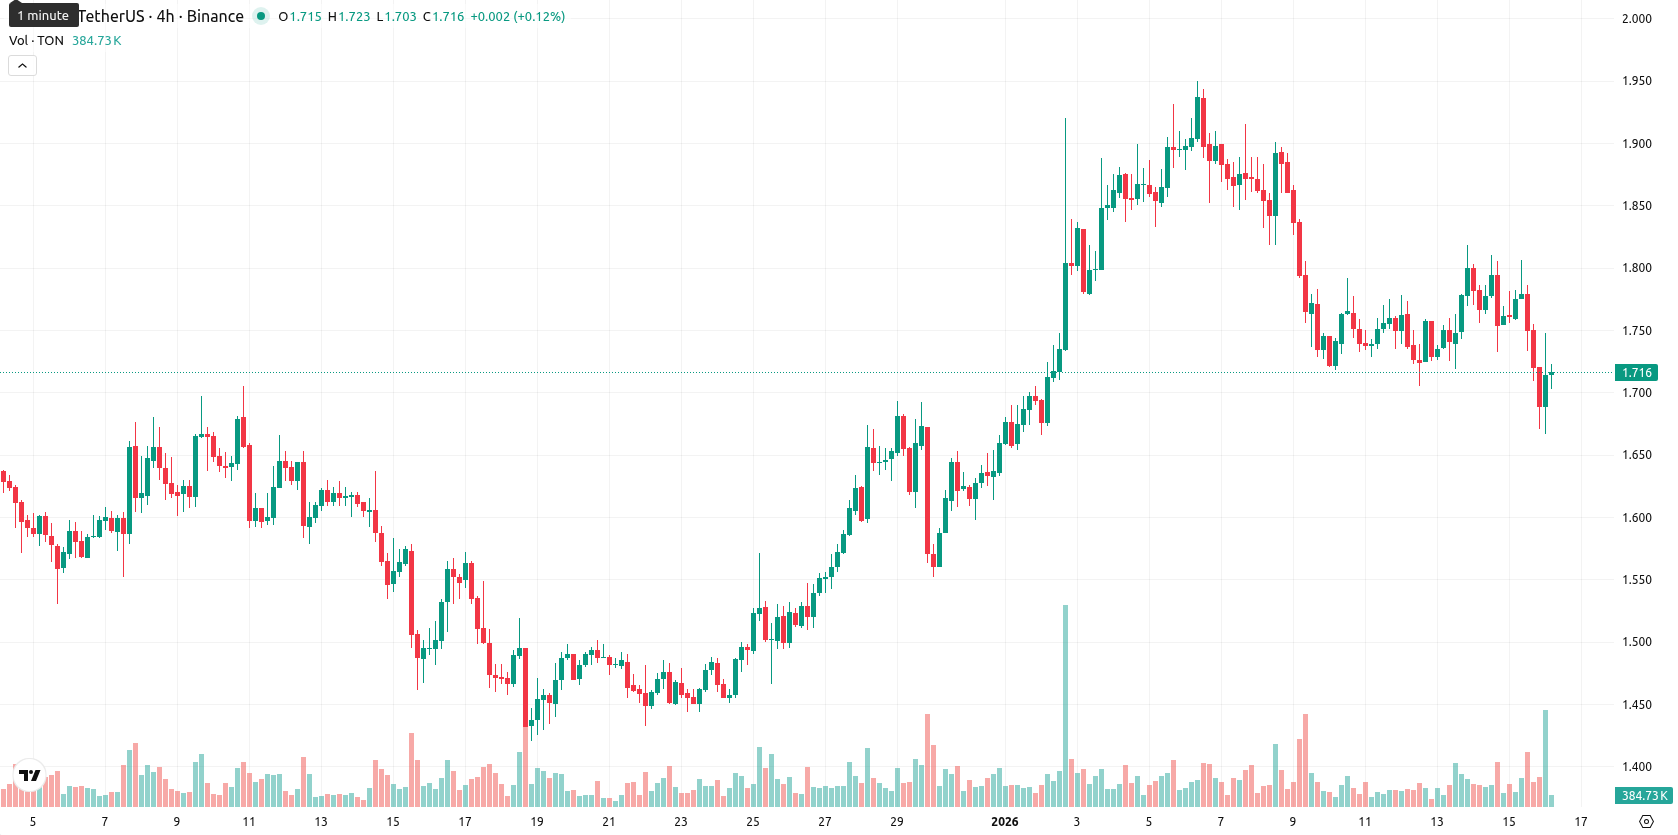
Toncoin falls as strong downside pressure and volatility dominate trading

Toncoin (TON) is trading at $1.711, which is below its MA-20 ($1.753) but above the MA-50 ($1.636), while the MA-200 ($2.480) remains well above the current price. This setup points to lingering short-term and medium-term downward pressure, while the longer-term trend stays bearish. The nearest dynamic levels are the Ichimoku Kijun at $1.689 as support, with MA-20 as the next resistance.
Highlights
- Toncoin recently achieved a trendline breakout, bolstering investor confidence and maintaining support above a key technical level.
- Solid liquidity is observed just below the current support zone in Toncoin, signaling resilient market leadership in the asset.
- These technical and liquidity factors continue to underpin ongoing positive sentiment around Toncoin among market participants.
Confidence strengthens after trendline breakout and robust support retention
Toncoin recently saw a trendline breakout, contributing to increased investor confidence and sustaining support above a key technical level. The market is currently observing solid liquidity just below this support zone, reflecting the asset's resilient market leadership. These factors have continued to underpin the positive sentiment around Toncoin.
Mixed momentum indicators signal potential relief amid prevailing downside
Momentum signals are mixed: the daily MACD suggests strong buy despite the ADX maintaining a sell bias and showing only moderate trend strength. RSI is in sell mode at 47.5, while Stochastic RSI is deeply oversold and CCI remains neutral, indicating a possible exhaustion of selling. Bull/Bear Power shows a slight buyer advantage, but with the daily price down 3.19% (from previous close $1.767 to open $1.689 with no significant gap) and price currently sitting mid-range between $1.667 and $1.748, intraday volatility appears moderate with pressure seen shortly after the open. Although downside pressure dominates, some oversold oscillators hint at possible relief, causing a clear divergence in short-term sentiment.
High downside risk persists as sideways range dominates outlook
For the coming five trading days, the typical volatility band relative to current levels is set between $1.62 and $1.78. The probability of further price decline is very high (more than 80%), making upward movement much less likely. The main scenario is sideways movement between $1.62 and $1.78, with a bullish breakdown requiring a sustained move above $1.78 and a bearish case developing if support at $1.62 is lost.
Currently, Toncoin is trading above its short- and medium-term moving averages, with momentum indicators such as MACD and ADX showing a bullish bias, while longer-term trend signals remain negative and the RSI reflects balanced conditions. Key support is found near $1.69, resistance near $1.80, and price action is expected to remain range-bound with limited breakout potential in the near term.


Latest TON News


-
 Afghanistan
-
 Albania
-
 Algeria
-
 Angola
-
 Argentina
-
 Armenia
-
 Australia
-
 Austria
-
 Azerbaijan
-
 Bahamas
-
 Bahrain
-
 Bangladesh
-
 Belarus
-
 Belgium
-
 Bolivia
-
 Botswana
-
 Brazil
-
 Brunei
-
 Bulgaria
-
 Cambodia
-
 Cameroon
-
 Canada
-
 Chile
Chile
-
 China
China
-
 Colombia
-
 Congo
Congo
-
 Costa Rica
-
 Cote d'Ivoire
-
 Croatia
-
 Cuba
Cuba
-
 Cyprus
-
 Czechia
-
 DR Congo
-
 Denmark
-
 Dominican Republic
-
 Ecuador
-
 Egypt
Egypt
-
 El Salvador
-
 Estonia
-
 Eswatini
-
 Ethiopia
-
 Finland
-
 France
-
 Georgia
-
 Germany
-
 Ghana
Ghana
-
 Greece
-
 Haiti
Haiti
-
 Hong Kong
-
 Hungary
-
 India
India
-
 Indonesia
-
 Iran, Islamic republic
-
 Iraq
Iraq
-
 Ireland
-
 Israel
-
 Italy
Italy
-
 Jamaica
-
 Japan
Japan
-
 Jordan
-
 Kazakhstan
-
 Kenya
Kenya
-
 Korea
Korea
-
 Kuwait
-
 Kyrgyzstan
-
 Laos
Laos
-
 Latvia
-
 Lebanon
-
 Lesotho
-
 Libya
Libya
-
 Lithuania
-
 Luxembourg
-
 Madagascar
-
 Malaysia
-
 Malta
Malta
-
 Mauritius
-
 Mexico
-
 Moldova
-
 Mongolia
-
 Montenegro
-
 Morocco
-
 Mozambique
-
 Myanmar
-
 Namibia
-
 Nepal
Nepal
-
 Netherlands
-
 New Zealand
-
 Nigeria
-
 North Macedonia
-
 Norway
-
 Oman
Oman
-
 Pakistan
-
 Palestine
-
 Panama
-
 Papua New Guinea
-
 Paraguay
-
 Peru
Peru
-
 Philippines
-
 Poland
-
 Portugal
-
 Puerto Rico
-
 Qatar
Qatar
-
 Reunion
-
 Romania
-
 Rwanda
-
 Saudi Arabia
-
 Serbia
-
 Singapore
-
 Slovakia
-
 Slovenia
-
 Somalia
-
 South Africa
-
 Spain
Spain
-
 Sri Lanka
-
 Sweden
-
 Switzerland
-
 Syria
Syria
-
 Taiwan
-
 Tajikistan
-
 Tanzania
-
 Thailand
-
 Trinidad and Tobago
-
 Tunisia
-
 Turkey
-
 UAE
UAE
-
 Uganda
-
 Ukraine
-
 United Kingdom
-
United States
-
 Uruguay
-
 Uzbekistan
-
 Venezuela
-
 Vietnam
-
 Yemen
Yemen
-
 Zambia
-
 Zimbabwe
- Forex
- Crypto
