
OP weekly forecast: price drops amid oversold readings and persistent negative momentum

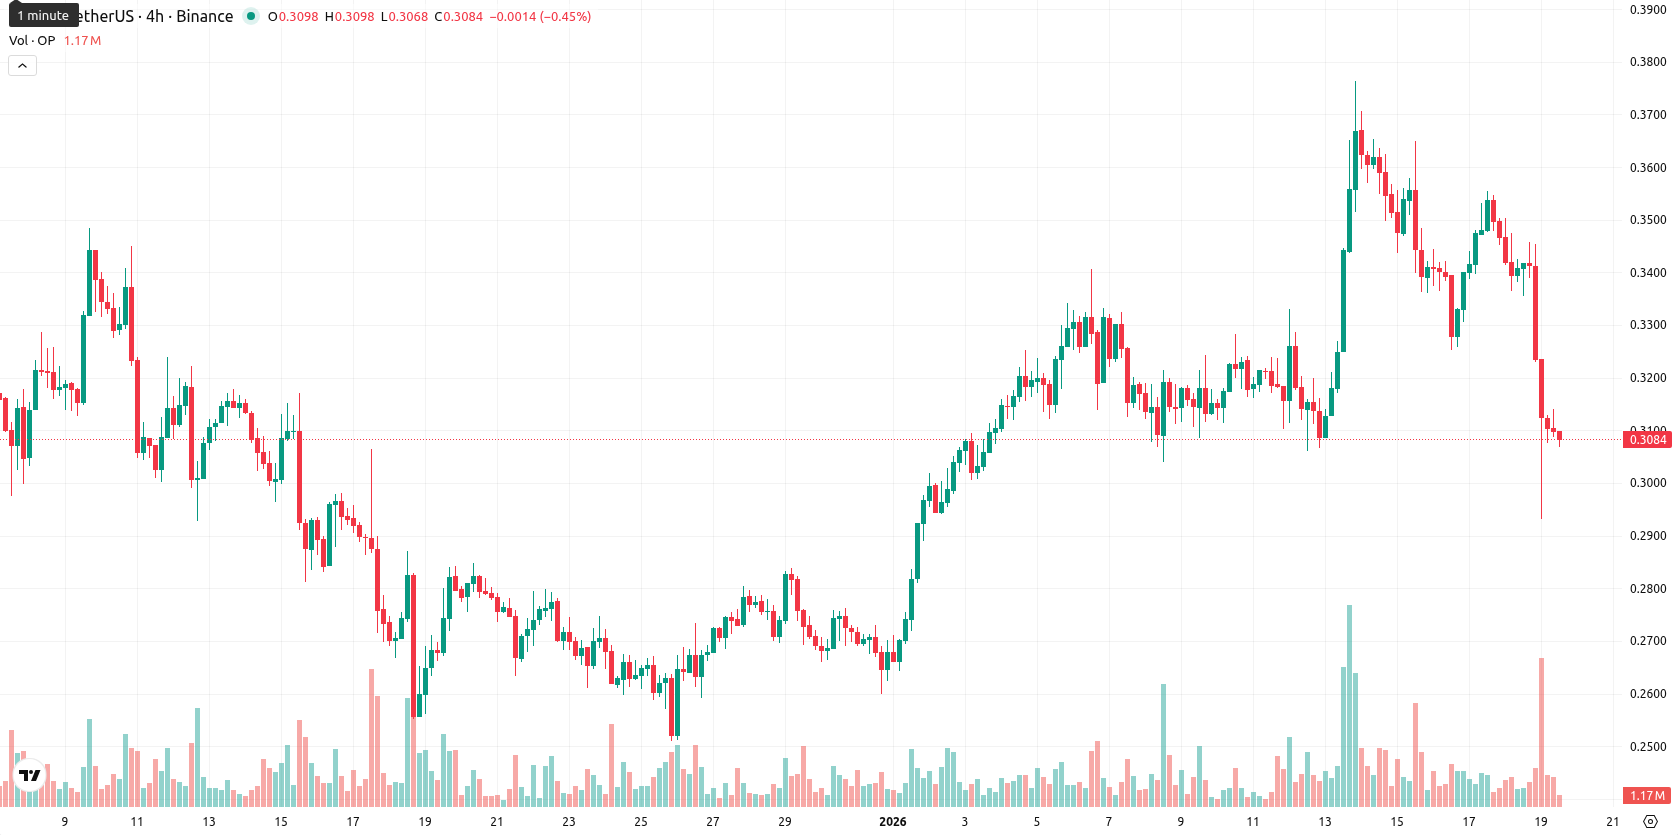
Optimism (OP) is trading at $0.3084 following a 4.79% decline over the past week. The asset remains firmly below its weekly MA-20 ($0.4530) and MA-50 ($0.6398), highlighting ongoing bearish pressure and a negative trend relative to key averages.
Highlights
- The Optimism Foundation proposes allocating 50% of sequencer revenue for monthly OP token buybacks starting February 2026, utilizing 5,868 ETH annual revenue as basis.
- Optimism’s Superchain ecosystem now processes 13% of all blockchain transactions and holds a dominant 58.6% share of Layer 2 fees, driven by partners like Sony, Base, and Worldcoin.
- OP is expanding its use cases in payment and wallet innovation and is reportedly involved in euro-denominated stablecoin development to broaden ecosystem utility.
Buyback proposal and ecosystem growth spur activity despite sluggish price
The Optimism Foundation has initiated a governance proposal to allocate 50% of sequencer revenue for monthly OP token buybacks starting February 2026, leveraging revenue reported at 5,868 ETH over the past year. Optimism’s Superchain ecosystem now processes 13% of all blockchain transactions and controls a 58.6% share of Layer 2 fees, with large-scale adoption from partners like Sony, Base, and Worldcoin. OP is also supporting payment and wallet innovations, and is reportedly involved in euro-denominated stablecoin development. The buyback proposal underpins recent activity and introduces a new value accrual mechanism for the ecosystem.
Bearish dominance intensifies with weak momentum and oversold signals this week
Technical signals from the weekly (W1) timeframe confirm strong bearish dominance for OP. The price remains well below major resistance levels, with MA-20 at $0.4530, MA-50 at $0.6398, and Ichimoku Kijun resistance positioned at $0.5233. Weekly oscillators indicate oversold conditions (RSI at 38.2, CCI at -51.3), while momentum remains negative as both MACD and ADX show continued selling and a lack of upward drive. Stoch RSI highlights recent volatility with short-lived overbought moves, and Bollinger Band Percentile suggests sellers have stayed in control as the market recorded elevated volatility within the week’s $0.3764 high and $0.3085 low.
Sideways range likely as bearish technicals dampen breakout prospects next week
Looking ahead, OP is expected to remain within a $0.2780 to $0.3320 range over the coming week, tracking typical volatility and lackluster demand. The probability of a significant bounce is low — with less than a 20% chance of breaking higher toward MA-20 resistance, while continued sell-side momentum may push the price below $0.2780 for another weekly low. The baseline forecast is for sideways action inside this corridor, given persistent bearish technicals and subdued recovery signals.
Previously it was noted that Optimism (OP) maintained short and medium-term bullish signals, supported by MACD and ADX indicators, despite residing below the long-term moving average. Several oscillators reflected overbought conditions and heightened volatility, with buyers maintain control and key dynamic supports remaining in place.


Latest Optimism News


-
 Afghanistan
-
 Albania
-
 Algeria
-
 Angola
-
 Argentina
-
 Armenia
-
 Australia
-
 Austria
-
 Azerbaijan
-
 Bahamas
-
 Bahrain
-
 Bangladesh
-
 Belarus
-
 Belgium
-
 Bolivia
-
 Botswana
-
 Brazil
-
 Brunei
-
 Bulgaria
-
 Cambodia
-
 Cameroon
-
 Canada
-
 Chile
Chile
-
 China
China
-
 Colombia
-
 Congo
Congo
-
 Costa Rica
-
 Cote d'Ivoire
-
 Croatia
-
 Cuba
Cuba
-
 Cyprus
-
 Czechia
-
 DR Congo
-
 Denmark
-
 Dominican Republic
-
 Ecuador
-
 Egypt
Egypt
-
 El Salvador
-
 Estonia
-
 Eswatini
-
 Ethiopia
-
 Finland
-
 France
-
 Georgia
-
 Germany
-
 Ghana
Ghana
-
 Greece
-
 Haiti
Haiti
-
 Hong Kong
-
 Hungary
-
 India
India
-
 Indonesia
-
 Iran, Islamic republic
-
 Iraq
Iraq
-
 Ireland
-
 Israel
-
 Italy
Italy
-
 Jamaica
-
 Japan
Japan
-
 Jordan
-
 Kazakhstan
-
 Kenya
Kenya
-
 Korea
Korea
-
 Kuwait
-
 Kyrgyzstan
-
 Laos
Laos
-
 Latvia
-
 Lebanon
-
 Lesotho
-
 Libya
Libya
-
 Lithuania
-
 Luxembourg
-
 Madagascar
-
 Malaysia
-
 Malta
Malta
-
 Mauritius
-
 Mexico
-
 Moldova
-
 Mongolia
-
 Montenegro
-
 Morocco
-
 Mozambique
-
 Myanmar
-
 Namibia
-
 Nepal
Nepal
-
 Netherlands
-
 New Zealand
-
 Nigeria
-
 North Macedonia
-
 Norway
-
 Oman
Oman
-
 Pakistan
-
 Palestine
-
 Panama
-
 Papua New Guinea
-
 Paraguay
-
 Peru
Peru
-
 Philippines
-
 Poland
-
 Portugal
-
 Puerto Rico
-
 Qatar
Qatar
-
 Reunion
-
 Romania
-
 Rwanda
-
 Saudi Arabia
-
 Serbia
-
 Singapore
-
 Slovakia
-
 Slovenia
-
 Somalia
-
 South Africa
-
 Spain
Spain
-
 Sri Lanka
-
 Sweden
-
 Switzerland
-
 Syria
Syria
-
 Taiwan
-
 Tajikistan
-
 Tanzania
-
 Thailand
-
 Trinidad and Tobago
-
 Tunisia
-
 Turkey
-
 UAE
UAE
-
 Uganda
-
 Ukraine
-
 United Kingdom
-
United States
-
 Uruguay
-
 Uzbekistan
-
 Venezuela
-
 Vietnam
-
 Yemen
Yemen
-
 Zambia
-
 Zimbabwe
- Forex
- Crypto
