
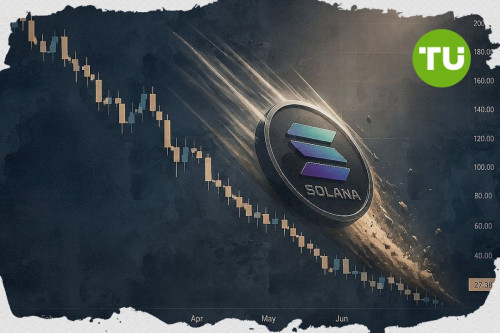
Solana price prediction: further downside risk as SOL slumps below key moving averages

Solana (SOL) is trading at $117.78, notably below its MA-20 at $136.88, MA-50 at $131.66, and MA-200 at $171.91, signaling persistent downward pressure across the short, medium, and long-term trends. The nearest dynamic resistance is the Ichimoku Kijun at $135.66, while no immediate support is offered by major moving averages above the current price.
Highlights
- Solana (SOL) closed at $117.78, falling 7.51% on the day and trading well below its MA-20, MA-50, and MA-200 levels.
- Bearish momentum prevails, with MACD negative, ADX at 20.59, and multiple oversold signals from RSI, Stochastic RSI, and Commodity Channel Index.
- SOL’s dynamic resistance is the Ichimoku Kijun at $135.66; expected five-day trading range is $115.50–$124.50, with <20% probability of a price rebound.
Ecosystem innovation and ETFs drive mixed institutional flows
Solana's network saw significant growth with over 2.3 billion transactions processed in the past month and nearly $10 billion locked in DeFi protocols. Integrations by firms like Ave.ai, which upgraded its trading system for millisecond transactions, and Ondo Finance, which launched tokenized equities including Nvidia and Microsoft on the Solana blockchain, underscore continued ecosystem innovation. Major institutional collaboration progressed as R3 launched native protocols to bring yield products on-chain, while regulated investment vehicles for Solana, such as the 21Shares Solana ETF and Franklin SOEZ ETF, experienced mixed investor flows.

Oversold signals and seller dominance reinforce bearish momentum
Momentum indicators present a bearish picture, with the MACD on D1 neutral but negative and the ADX at 20.59, pointing to a weak but prevailing negative trend. The RSI and Stochastic RSI both indicate oversold conditions, accompanied by an oversold reading from the Commodity Channel Index. Bull/Bear Power at -4.81 affirms strong seller dominance intraday, supported by the continued bearish direction of the Awesome Oscillator.
Downside risk elevated as narrow range and resistance challenge reversal
For the next five trading days, the expected price range sits in a typical volatility band of $115.50 to $124.50. There is a very low probability (less than 20%) of a price increase, making a further decline more likely according to current weekly momentum and moving average signals. In the baseline scenario, SOL is likely to stabilize in a narrow corridor just above recent lows. A bullish outcome would require breaking resistance near $126– $128, while a drop below $115.50 could trigger renewed selling and test deeper support.
Last time, analysts noted that Solana closed the week with pronounced bearish momentum, trading below its key short- and medium-term moving averages while remaining above longer-term support levels. Technical indicators including the RSI, MACD, and several oscillators signaled persistent selling pressure and oversold conditions, suggesting continued consolidation between primary support at $121 and resistance near $135, with limited prospects for a near-term rebound.


-
 Afghanistan
-
 Albania
-
 Algeria
-
 Angola
-
 Argentina
-
 Armenia
-
 Australia
-
 Austria
-
 Azerbaijan
-
 Bahamas
-
 Bahrain
-
 Bangladesh
-
 Belarus
-
 Belgium
-
 Bolivia
-
 Botswana
-
 Brazil
-
 Brunei
-
 Bulgaria
-
 Cambodia
-
 Cameroon
-
 Canada
-
 Chile
Chile
-
 China
China
-
 Colombia
-
 Congo
Congo
-
 Costa Rica
-
 Cote d'Ivoire
-
 Croatia
-
 Cuba
Cuba
-
 Cyprus
-
 Czechia
-
 DR Congo
-
 Denmark
-
 Dominican Republic
-
 Ecuador
-
 Egypt
Egypt
-
 El Salvador
-
 Estonia
-
 Eswatini
-
 Ethiopia
-
 Finland
-
 France
-
 Georgia
-
 Germany
-
 Ghana
Ghana
-
 Greece
-
 Haiti
Haiti
-
 Hong Kong
-
 Hungary
-
 India
India
-
 Indonesia
-
 Iran, Islamic republic
-
 Iraq
Iraq
-
 Ireland
-
 Israel
-
 Italy
Italy
-
 Jamaica
-
 Japan
Japan
-
 Jordan
-
 Kazakhstan
-
 Kenya
Kenya
-
 Korea
Korea
-
 Kuwait
-
 Kyrgyzstan
-
 Laos
Laos
-
 Latvia
-
 Lebanon
-
 Lesotho
-
 Libya
Libya
-
 Lithuania
-
 Luxembourg
-
 Madagascar
-
 Malaysia
-
 Malta
Malta
-
 Mauritius
-
 Mexico
-
 Moldova
-
 Mongolia
-
 Montenegro
-
 Morocco
-
 Mozambique
-
 Myanmar
-
 Namibia
-
 Nepal
Nepal
-
 Netherlands
-
 New Zealand
-
 Nigeria
-
 North Macedonia
-
 Norway
-
 Oman
Oman
-
 Pakistan
-
 Palestine
-
 Panama
-
 Papua New Guinea
-
 Paraguay
-
 Peru
Peru
-
 Philippines
-
 Poland
-
 Portugal
-
 Puerto Rico
-
 Qatar
Qatar
-
 Reunion
-
 Romania
-
 Rwanda
-
 Saudi Arabia
-
 Serbia
-
 Singapore
-
 Slovakia
-
 Slovenia
-
 Somalia
-
 South Africa
-
 Spain
Spain
-
 Sri Lanka
-
 Sweden
-
 Switzerland
-
 Syria
Syria
-
 Taiwan
-
 Tajikistan
-
 Tanzania
-
 Thailand
-
 Trinidad and Tobago
-
 Tunisia
-
 Turkey
-
 UAE
UAE
-
 Uganda
-
 Ukraine
-
 United Kingdom
-
United States
-
 Uruguay
-
 Uzbekistan
-
 Venezuela
-
 Vietnam
-
 Yemen
Yemen
-
 Zambia
-
 Zimbabwe
- Forex
- Crypto
