
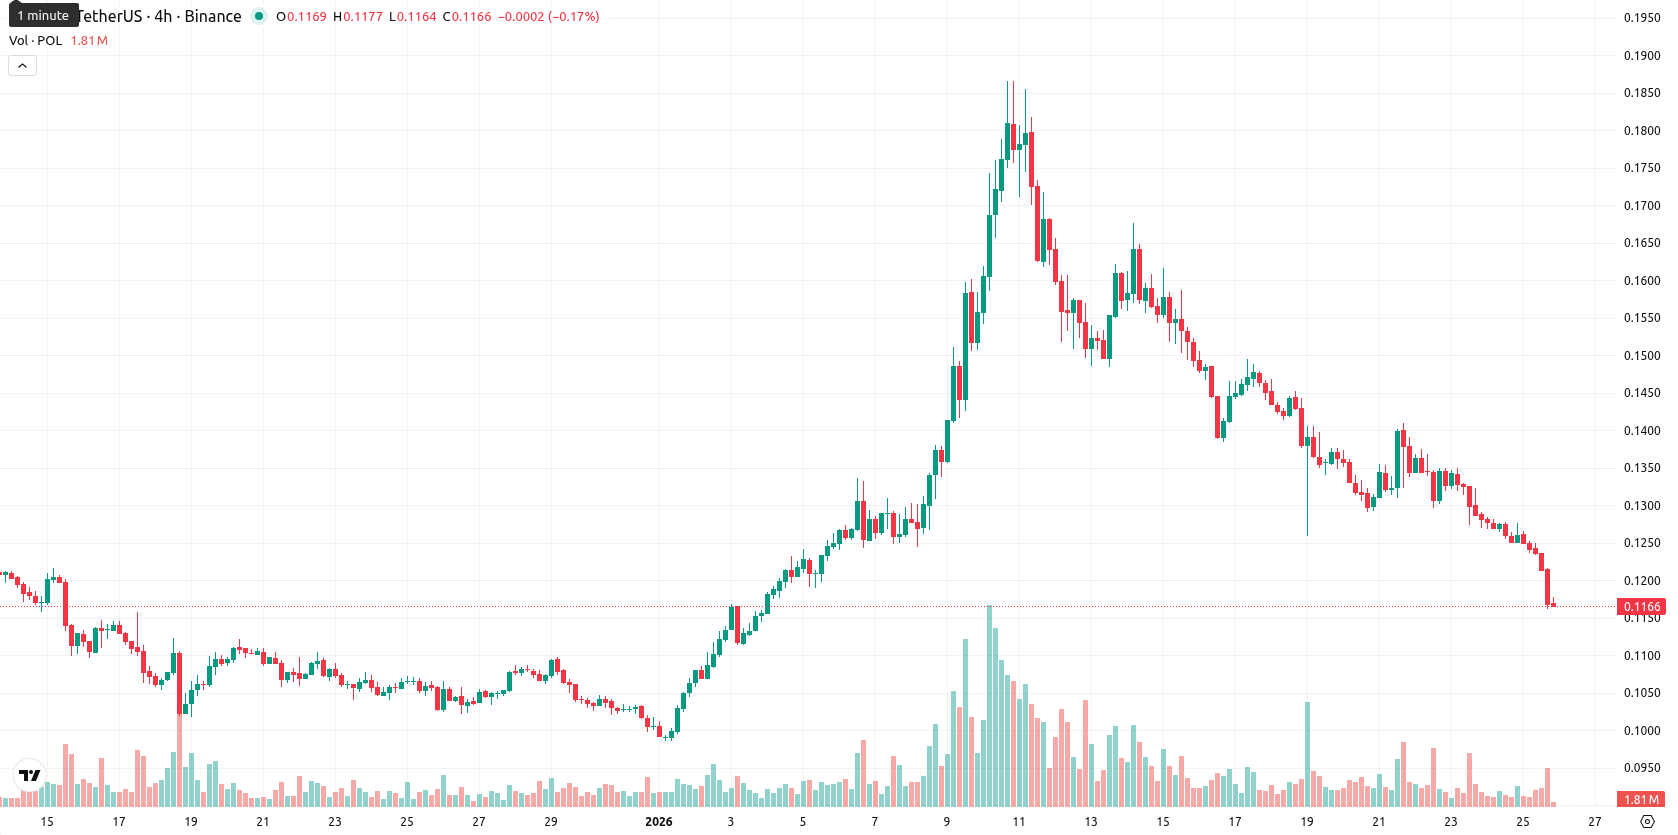
-7.46% for Polygon — breakdown below key moving averages weighs on price

Polygon (POL, formerly MATIC) closed at $0.1166, marking a daily drop of 7.46%. The price is trading decisively below the MA-20 ($0.1422), MA-50 ($0.1243), and MA-200 ($0.1915), confirming persistent short-, medium-, and long-term bearish pressure.
Highlights
- POL trades at $0.1166, below its MA-20 ($0.1422), MA-50 ($0.1243), and MA-200 ($0.1915), confirming persistent bearish pressure across all timeframes.
- Momentum indicators show a strong daily MACD buy signal but seller dominance is confirmed by ADX, with RSI at 44 and Stochastic RSI oversold.
- The expected price range for the coming week is $0.1075–$0.1190, with less than a 20% probability of price upside and risk of further declines if $0.1075 breaks.
Oscillator-driven weakness amid conflicting MACD momentum
Dynamic resistance for POL is found at the Ichimoku Kijun ($0.1426), with the MA-50 ($0.1243) acting as the nearest overhead resistance. Momentum indicators reveal the MACD signaling a strong buy on the daily chart, but the ADX highlights seller dominance in an active downtrend. The RSI is at 44, Stochastic RSI is oversold, and the CCI is deeply negative, all pointing to short-term weakness and an oversold state. Bull/Bear Power remains negative and, apart from the neutral Awesome Oscillator and bullish MACD, most oscillators confirm continued bearish momentum.
Breakout threshold lowers as downside risk persists
In the short term, typical volatility suggests POL is likely to consolidate between $0.1075 and $0.1190. The probability of a move higher is low, with a further decline more likely if the price breaks below $0.1075. Upside momentum would require a sustained close above $0.1243 — $0.1426 to validate a bullish scenario.
Last time, analysts noted that Polygon (POL) closed the week under significant selling pressure, remaining well below its key moving averages while technical indicators—including MACD, RSI, and Stoch RSI—continued to signal a bearish outlook and potential movement toward oversold conditions. The prevailing trend is sideways within a narrow range, with downside bias expected to persist unless the price can decisively break above nearby resistance.


-
 Afghanistan
-
 Albania
-
 Algeria
-
 Angola
-
 Argentina
-
 Armenia
-
 Australia
-
 Austria
-
 Azerbaijan
-
 Bahamas
-
 Bahrain
-
 Bangladesh
-
 Belarus
-
 Belgium
-
 Bolivia
-
 Botswana
-
 Brazil
-
 Brunei
-
 Bulgaria
-
 Cambodia
-
 Cameroon
-
 Canada
-
 Chile
Chile
-
 China
China
-
 Colombia
-
 Congo
Congo
-
 Costa Rica
-
 Cote d'Ivoire
-
 Croatia
-
 Cuba
Cuba
-
 Cyprus
-
 Czechia
-
 DR Congo
-
 Denmark
-
 Dominican Republic
-
 Ecuador
-
 Egypt
Egypt
-
 El Salvador
-
 Estonia
-
 Eswatini
-
 Ethiopia
-
 Finland
-
 France
-
 Georgia
-
 Germany
-
 Ghana
Ghana
-
 Greece
-
 Haiti
Haiti
-
 Hong Kong
-
 Hungary
-
 India
India
-
 Indonesia
-
 Iran, Islamic republic
-
 Iraq
Iraq
-
 Ireland
-
 Israel
-
 Italy
Italy
-
 Jamaica
-
 Japan
Japan
-
 Jordan
-
 Kazakhstan
-
 Kenya
Kenya
-
 Korea
Korea
-
 Kuwait
-
 Kyrgyzstan
-
 Laos
Laos
-
 Latvia
-
 Lebanon
-
 Lesotho
-
 Libya
Libya
-
 Lithuania
-
 Luxembourg
-
 Madagascar
-
 Malaysia
-
 Malta
Malta
-
 Mauritius
-
 Mexico
-
 Moldova
-
 Mongolia
-
 Montenegro
-
 Morocco
-
 Mozambique
-
 Myanmar
-
 Namibia
-
 Nepal
Nepal
-
 Netherlands
-
 New Zealand
-
 Nigeria
-
 North Macedonia
-
 Norway
-
 Oman
Oman
-
 Pakistan
-
 Palestine
-
 Panama
-
 Papua New Guinea
-
 Paraguay
-
 Peru
Peru
-
 Philippines
-
 Poland
-
 Portugal
-
 Puerto Rico
-
 Qatar
Qatar
-
 Reunion
-
 Romania
-
 Rwanda
-
 Saudi Arabia
-
 Serbia
-
 Singapore
-
 Slovakia
-
 Slovenia
-
 Somalia
-
 South Africa
-
 Spain
Spain
-
 Sri Lanka
-
 Sweden
-
 Switzerland
-
 Syria
Syria
-
 Taiwan
-
 Tajikistan
-
 Tanzania
-
 Thailand
-
 Trinidad and Tobago
-
 Tunisia
-
 Turkey
-
 UAE
UAE
-
 Uganda
-
 Ukraine
-
 United Kingdom
-
United States
-
 Uruguay
-
 Uzbekistan
-
 Venezuela
-
 Vietnam
-
 Yemen
Yemen
-
 Zambia
-
 Zimbabwe
- Forex
- Crypto
