
Jupiter: Session volatility and weak support drive 7.98% decline intraday

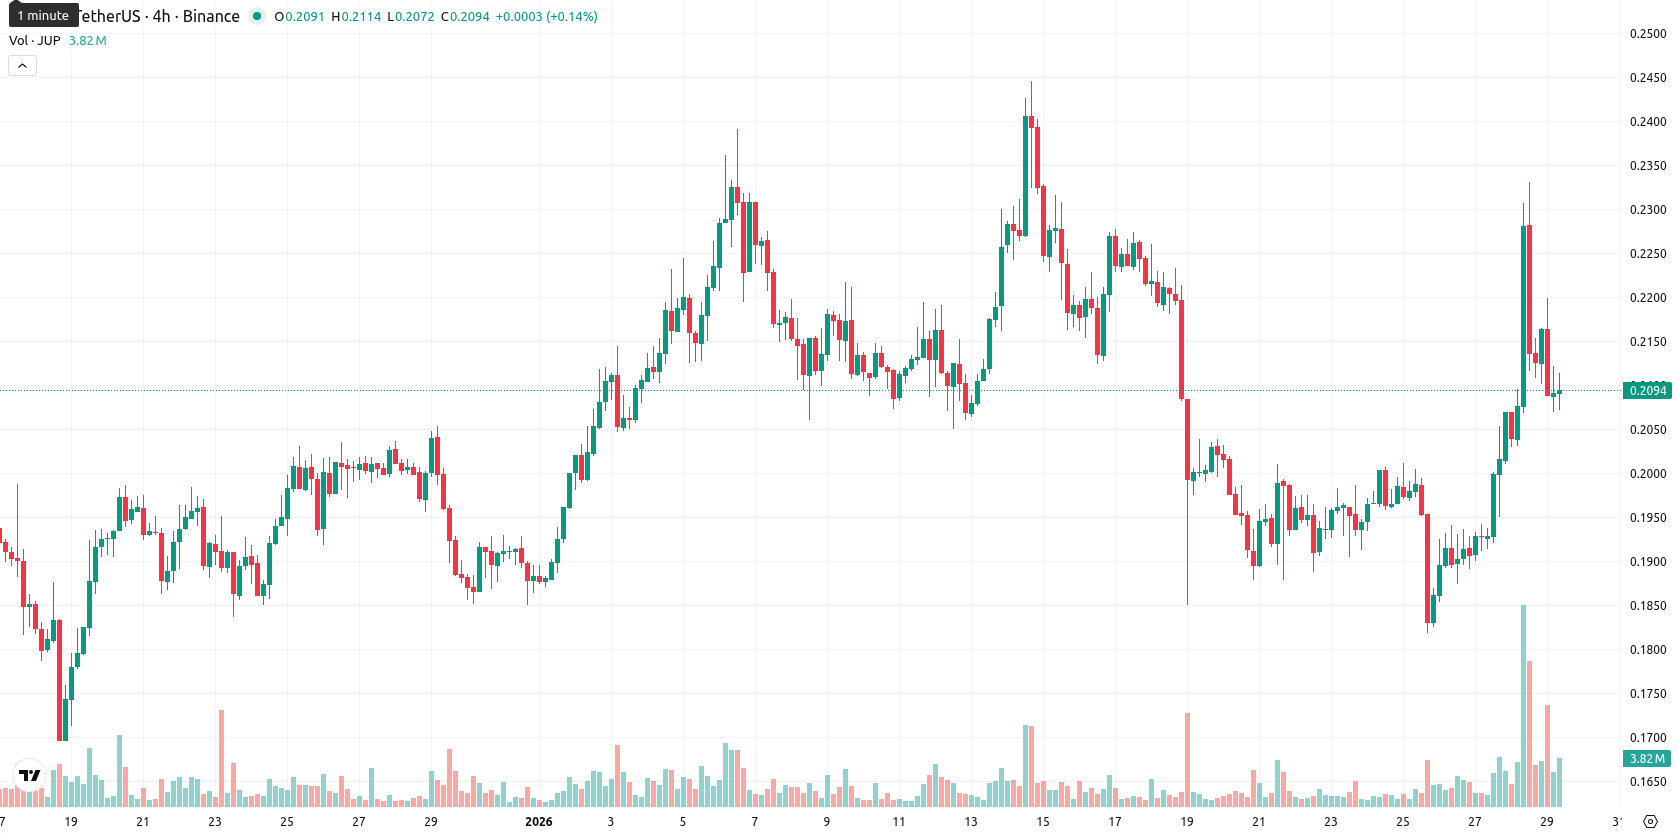
Jupiter (JUP) is currently trading at $0.2099, slightly above its MA-20 ($0.2074) and MA-50 ($0.2036), but well below the MA-200 ($0.3724). This configuration points to a short-term bullish bias and medium-term support, while the long-term outlook remains bearish, with the Ichimoku Kijun at $0.2132 serving as nearby resistance and MA-50 acting as additional support.
 0.203
0.2176
0.203
0.2176
Highlights
- JUP trades at $0.2099, slightly above MA-20 ($0.2074) and MA-50 ($0.2036), but remains well below the bearish MA-200 ($0.3724).
- Momentum indicators are mixed: strong daily MACD selling pressure contrasts with a modestly bullish ADX and a neutral-to-bullish RSI at 54.8.
- JUP faces near-term resistance at the Ichimoku Kijun ($0.2132) with critical support at $0.2069; probability of upside in the next five days remains below 20%.
Mixed momentum signals as intraday volatility and downside risk build
Momentum signals for JUP are mixed. The D1 MACD indicates strong selling pressure, and while the ADX provides modest support for buyers, the RSI (D1) is neutral-to-bullish at 54.8. The Commodity Channel Index signals ongoing upward pressure, though Stochastic RSI flags an overbought market at current levels. Bull/Bear Power remains positive, confirming buyer dominance intraday; however, today's trading has been under heavy pressure with high volatility and the price hugging the session's lows, highlighting risks of short-term mean reversion if support fails.
Downside risk emphasized as consolidation expected to dominate
For the next five trading days, the typical volatility band for JUP is expected between $0.2050 and $0.2284. With less than a 20% probability of a price increase, a pullback or sideways movement is much more probable in the short term. The baseline scenario calls for JUP to consolidate around $0.21 – $0.22 as bulls and bears compete for momentum. A move above $0.2132 could open the path to $0.2280, but near-term risk is skewed to the downside, especially if support at $0.2069 gives way and a retest of $0.2050 occurs.
Last time, analysts noted that Jupiter (JUP) is exhibiting short-term bullish momentum as it holds above its 20- and 50-day moving averages, though it remains well below the 200-day moving average, indicating persistent long-term bearish pressure. Immediate resistance is identified at the Ichimoku Kijun, while notable support lies near the MA-50 amid elevated intraday volatility.








-
 Afghanistan
-
 Albania
-
 Algeria
-
 Angola
-
 Argentina
-
 Armenia
-
 Australia
-
 Austria
-
 Azerbaijan
-
 Bahamas
-
 Bahrain
-
 Bangladesh
-
 Belarus
-
 Belgium
-
 Bolivia
-
 Botswana
-
 Brazil
-
 Brunei
-
 Bulgaria
-
 Cambodia
-
 Cameroon
-
 Canada
-
 Chile
Chile
-
 China
China
-
 Colombia
-
 Congo
Congo
-
 Costa Rica
-
 Cote d'Ivoire
-
 Croatia
-
 Cuba
Cuba
-
 Cyprus
-
 Czechia
-
 DR Congo
-
 Denmark
-
 Dominican Republic
-
 Ecuador
-
 Egypt
Egypt
-
 El Salvador
-
 Estonia
-
 Eswatini
-
 Ethiopia
-
 Finland
-
 France
-
 Georgia
-
 Germany
-
 Ghana
Ghana
-
 Greece
-
 Haiti
Haiti
-
 Hong Kong
-
 Hungary
-
 India
India
-
 Indonesia
-
 Iran, Islamic republic
-
 Iraq
Iraq
-
 Ireland
-
 Israel
-
 Italy
Italy
-
 Jamaica
-
 Japan
Japan
-
 Jordan
-
 Kazakhstan
-
 Kenya
Kenya
-
 Korea
Korea
-
 Kuwait
-
 Kyrgyzstan
-
 Laos
Laos
-
 Latvia
-
 Lebanon
-
 Lesotho
-
 Libya
Libya
-
 Lithuania
-
 Luxembourg
-
 Madagascar
-
 Malaysia
-
 Malta
Malta
-
 Mauritius
-
 Mexico
-
 Moldova
-
 Mongolia
-
 Montenegro
-
 Morocco
-
 Mozambique
-
 Myanmar
-
 Namibia
-
 Nepal
Nepal
-
 Netherlands
-
 New Zealand
-
 Nigeria
-
 North Macedonia
-
 Norway
-
 Oman
Oman
-
 Pakistan
-
 Palestine
-
 Panama
-
 Papua New Guinea
-
 Paraguay
-
 Peru
Peru
-
 Philippines
-
 Poland
-
 Portugal
-
 Puerto Rico
-
 Qatar
Qatar
-
 Reunion
-
 Romania
-
 Rwanda
-
 Saudi Arabia
-
 Serbia
-
 Singapore
-
 Slovakia
-
 Slovenia
-
 Somalia
-
 South Africa
-
 Spain
Spain
-
 Sri Lanka
-
 Sweden
-
 Switzerland
-
 Syria
Syria
-
 Taiwan
-
 Tajikistan
-
 Tanzania
-
 Thailand
-
 Trinidad and Tobago
-
 Tunisia
-
 Turkey
-
 UAE
UAE
-
 Uganda
-
 Ukraine
-
 United Kingdom
-
United States
-
 Uruguay
-
 Uzbekistan
-
 Venezuela
-
 Vietnam
-
 Yemen
Yemen
-
 Zambia
-
 Zimbabwe
- Forex
- Crypto











