
Quant price prediction: Downside risk grows as QNT sinks below key averages

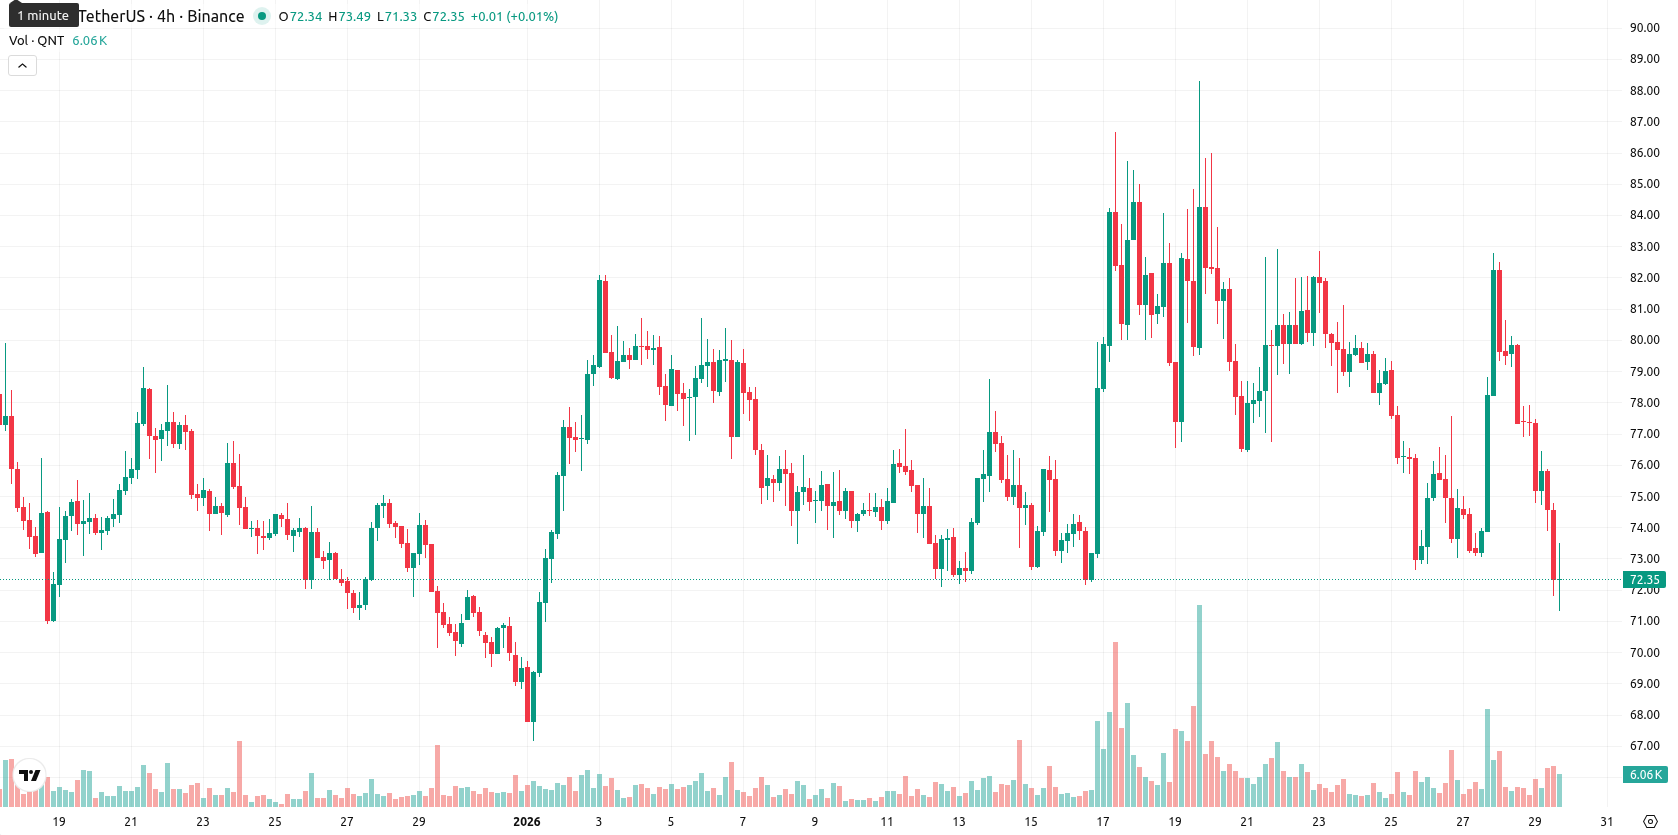
Quant (QNT) is trading at $71.83, positioned below its MA-20 at $77.56, MA-50 at $76.62, and MA-200 at $92.67, which signals sustained downward momentum across short-, medium-, and long-term levels.
 64.04
65.500000
64.04
65.500000
Highlights
- QNT trades at $71.83, significantly below its MA-20 ($77.56), MA-50 ($76.62), and MA-200 ($92.67), reflecting strong short-to-long-term downside pressure.
- Momentum is mixed: daily MACD signals a rare 'Strong Buy,' while RSI, Stochastic RSI, and weekly indicators are broadly bearish, indicating weak market sentiment.
- For the next five days, expect QNT to range between $68.80 and $76.23, with bearish consolidation likely; a drop below $68.80 could accelerate selling.
Divergent signals emerge as resistance limits and volatility rise
The closest dynamic resistance for QNT is the Ichimoku Kijun at $80.19, while potential support can be inferred near recent lows due to the lack of a defined level from Ichimoku. Momentum signals are mixed: the daily MACD stands out with a rare 'Strong Buy' despite most other indicators, including a low ADX, favoring weakness and showing a lack of trend strength. Both the RSI and Stochastic RSI indicate a soft market with sell and oversold signals, CCI is neutral, while intraday Bull/Bear Power points to sellers regaining control after brief buying. The price remains pressured near today’s lows, following significant intraday volatility and a 7.02% drop from the previous session, and the Awesome Oscillator stays neutral.
Bearish outlook prevails with volatility poised to test support
Over the next five sessions, QNT is expected to trade within a typical volatility band between $68.80 and $76.23, with a sideways consolidation as the baseline scenario. The probability of a short-term increase is low (less than 20%), with a further decline favored given bearish weekly technicals — MA-50, RSI, MACD, and ADX all align lower. If holding steady, prices may consolidate between the key support and resistance; a decisive move above $76.23 could trigger a short-term rebound, while a fall below $68.80 risks more pronounced selling and fresh weekly lows.
Previously it was reported that Quant is exhibiting strong short- and medium-term upward momentum above its 20-day and 50-day moving averages, though it remains capped by longer-term resistance at the 200-day moving average. Technical indicators reflect modest bullishness and persistent buyer dominance, but overbought signals and nearby resistance suggest sideways consolidation is likely in the near term.








-
 Afghanistan
-
 Albania
-
 Algeria
-
 Angola
-
 Argentina
-
 Armenia
-
 Australia
-
 Austria
-
 Azerbaijan
-
 Bahamas
-
 Bahrain
-
 Bangladesh
-
 Belarus
-
 Belgium
-
 Bolivia
-
 Botswana
-
 Brazil
-
 Brunei
-
 Bulgaria
-
 Cambodia
-
 Cameroon
-
 Canada
-
 Chile
Chile
-
 China
China
-
 Colombia
-
 Congo
Congo
-
 Costa Rica
-
 Cote d'Ivoire
-
 Croatia
-
 Cuba
Cuba
-
 Cyprus
-
 Czechia
-
 DR Congo
-
 Denmark
-
 Dominican Republic
-
 Ecuador
-
 Egypt
Egypt
-
 El Salvador
-
 Estonia
-
 Eswatini
-
 Ethiopia
-
 Finland
-
 France
-
 Georgia
-
 Germany
-
 Ghana
Ghana
-
 Greece
-
 Haiti
Haiti
-
 Hong Kong
-
 Hungary
-
 India
India
-
 Indonesia
-
 Iran, Islamic republic
-
 Iraq
Iraq
-
 Ireland
-
 Israel
-
 Italy
Italy
-
 Jamaica
-
 Japan
Japan
-
 Jordan
-
 Kazakhstan
-
 Kenya
Kenya
-
 Korea
Korea
-
 Kuwait
-
 Kyrgyzstan
-
 Laos
Laos
-
 Latvia
-
 Lebanon
-
 Lesotho
-
 Libya
Libya
-
 Lithuania
-
 Luxembourg
-
 Madagascar
-
 Malaysia
-
 Malta
Malta
-
 Mauritius
-
 Mexico
-
 Moldova
-
 Mongolia
-
 Montenegro
-
 Morocco
-
 Mozambique
-
 Myanmar
-
 Namibia
-
 Nepal
Nepal
-
 Netherlands
-
 New Zealand
-
 Nigeria
-
 North Macedonia
-
 Norway
-
 Oman
Oman
-
 Pakistan
-
 Palestine
-
 Panama
-
 Papua New Guinea
-
 Paraguay
-
 Peru
Peru
-
 Philippines
-
 Poland
-
 Portugal
-
 Puerto Rico
-
 Qatar
Qatar
-
 Reunion
-
 Romania
-
 Rwanda
-
 Saudi Arabia
-
 Serbia
-
 Singapore
-
 Slovakia
-
 Slovenia
-
 Somalia
-
 South Africa
-
 Spain
Spain
-
 Sri Lanka
-
 Sweden
-
 Switzerland
-
 Syria
Syria
-
 Taiwan
-
 Tajikistan
-
 Tanzania
-
 Thailand
-
 Trinidad and Tobago
-
 Tunisia
-
 Turkey
-
 UAE
UAE
-
 Uganda
-
 Ukraine
-
 United Kingdom
-
United States
-
 Uruguay
-
 Uzbekistan
-
 Venezuela
-
 Vietnam
-
 Yemen
Yemen
-
 Zambia
-
 Zimbabwe
- Forex
- Crypto












