
Relentless selling pressure hits technical levels — Arbitrum drops 8%

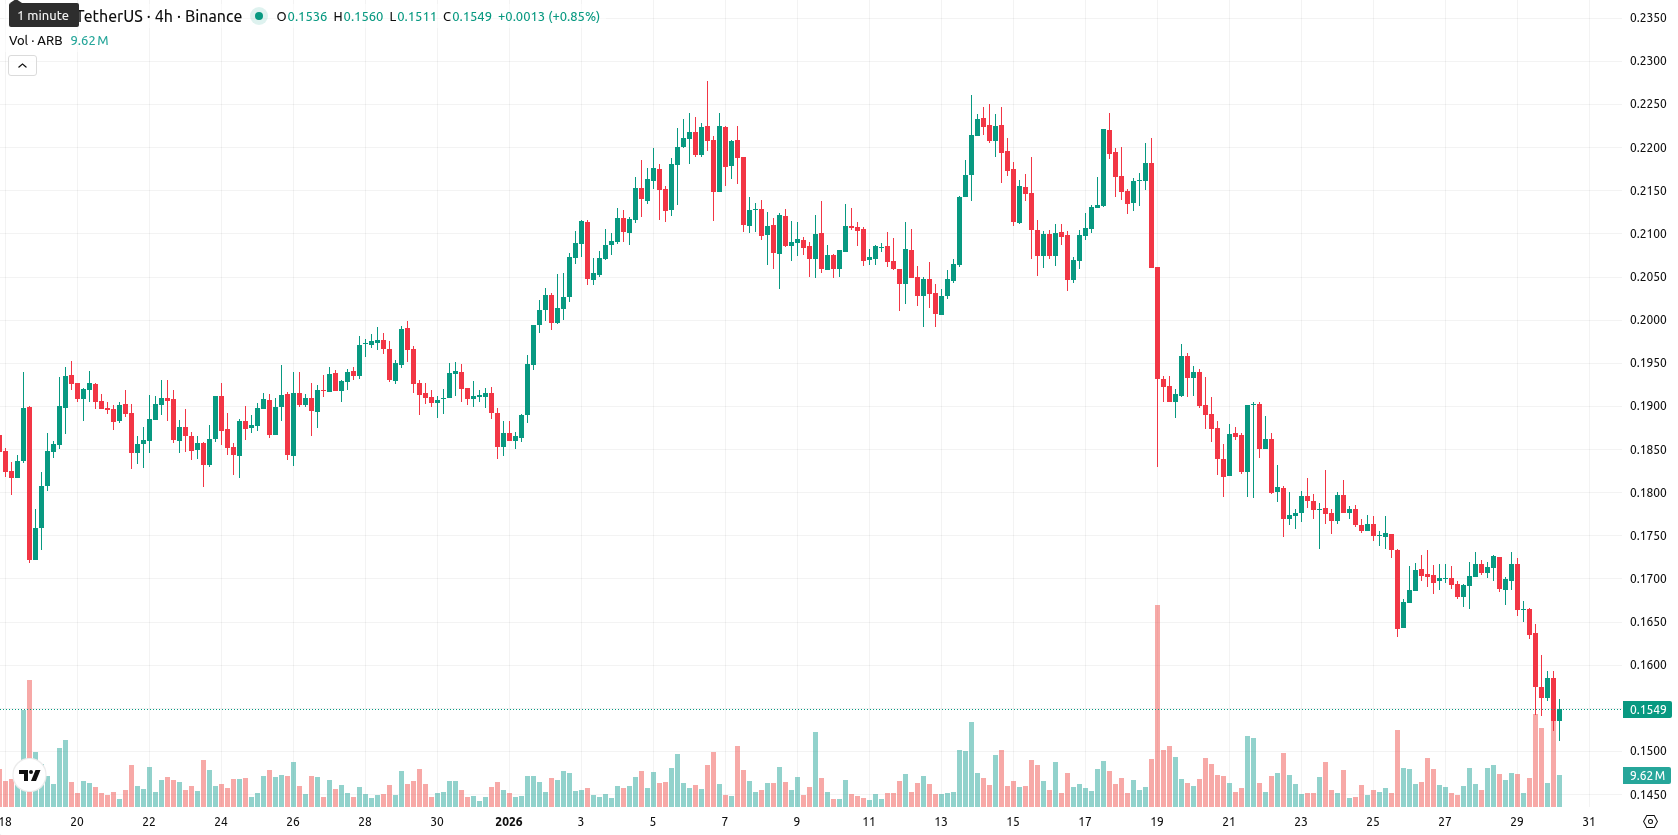
Arbitrum (ARB) is trading significantly below the MA-20 at $0.1911, MA-50 at $0.1960, and MA-200 at $0.3379, indicating persistent selling pressure across short, medium, and long timeframes. The intraday tone is weak, with price action near today's low and high volatility, while downside pressure dominates since the open.
Highlights
- ARB is trading well below its MA-20 ($0.1911), MA-50 ($0.1960), and MA-200 ($0.3379), confirming sustained short- and long-term bearish pressure.
- Momentum indicators show persistent bearish direction, with the MACD negative, ADX at 24 (strengthening), and RSI (29.4)/CCI (–117.8) both indicating oversold conditions.
- Expected five-day range is $0.1500–$0.1680 with less than 20% probability of an upside move, and critical support at $0.1500 threatens further downside if breached.
Bearish momentum confirmed as oversold signals cluster at weak support
Momentum signals remain strongly negative. The MACD points to a continued bearish trend, and an ADX near 24 suggests the current downtrend is strengthening but not yet at extreme levels. RSI at 29.4, CCI at –117.8, and a Stochastic RSI at zero all indicate oversold territory. Bull/Bear Power and the Awesome Oscillator confirm seller dominance, while the nearest resistance is the Ichimoku Kijun at $0.1907 and no immediate Ichimoku support appears at current prices.
Sideways consolidation expected amid low odds for upside reversal
For the next five trading days, ARB is expected to fluctuate within a typical volatility band between $0.1500 and $0.1680, reflecting recent elevated volatility. There is less than a 20% chance of upward moves, as no technical buy signals are present on weekly charts. The baseline scenario calls for sideways consolidation within this range, but a breakdown below $0.1500 could accelerate the decline, while a sustained move above $0.1680 might prompt a test of the Kijun resistance.
Previously it was reported that Arbitrum continues to exhibit strong bearish momentum, trading well below all major moving averages and facing persistent resistance, with technical indicators such as MACD, RSI, and Stochastic RSI deep in negative territory and volatility elevated. Over the coming sessions, the asset is likely to consolidate within a lower support band unless a breakout above key resistance levels occurs, while oversold signals and lack of buying pressure suggest further downside risk.


-
 Afghanistan
-
 Albania
-
 Algeria
-
 Angola
-
 Argentina
-
 Armenia
-
 Australia
-
 Austria
-
 Azerbaijan
-
 Bahamas
-
 Bahrain
-
 Bangladesh
-
 Belarus
-
 Belgium
-
 Bolivia
-
 Botswana
-
 Brazil
-
 Brunei
-
 Bulgaria
-
 Cambodia
-
 Cameroon
-
 Canada
-
 Chile
Chile
-
 China
China
-
 Colombia
-
 Congo
Congo
-
 Costa Rica
-
 Cote d'Ivoire
-
 Croatia
-
 Cuba
Cuba
-
 Cyprus
-
 Czechia
-
 DR Congo
-
 Denmark
-
 Dominican Republic
-
 Ecuador
-
 Egypt
Egypt
-
 El Salvador
-
 Estonia
-
 Eswatini
-
 Ethiopia
-
 Finland
-
 France
-
 Georgia
-
 Germany
-
 Ghana
Ghana
-
 Greece
-
 Haiti
Haiti
-
 Hong Kong
-
 Hungary
-
 India
India
-
 Indonesia
-
 Iran, Islamic republic
-
 Iraq
Iraq
-
 Ireland
-
 Israel
-
 Italy
Italy
-
 Jamaica
-
 Japan
Japan
-
 Jordan
-
 Kazakhstan
-
 Kenya
Kenya
-
 Korea
Korea
-
 Kuwait
-
 Kyrgyzstan
-
 Laos
Laos
-
 Latvia
-
 Lebanon
-
 Lesotho
-
 Libya
Libya
-
 Lithuania
-
 Luxembourg
-
 Madagascar
-
 Malaysia
-
 Malta
Malta
-
 Mauritius
-
 Mexico
-
 Moldova
-
 Mongolia
-
 Montenegro
-
 Morocco
-
 Mozambique
-
 Myanmar
-
 Namibia
-
 Nepal
Nepal
-
 Netherlands
-
 New Zealand
-
 Nigeria
-
 North Macedonia
-
 Norway
-
 Oman
Oman
-
 Pakistan
-
 Palestine
-
 Panama
-
 Papua New Guinea
-
 Paraguay
-
 Peru
Peru
-
 Philippines
-
 Poland
-
 Portugal
-
 Puerto Rico
-
 Qatar
Qatar
-
 Reunion
-
 Romania
-
 Rwanda
-
 Saudi Arabia
-
 Serbia
-
 Singapore
-
 Slovakia
-
 Slovenia
-
 Somalia
-
 South Africa
-
 Spain
Spain
-
 Sri Lanka
-
 Sweden
-
 Switzerland
-
 Syria
Syria
-
 Taiwan
-
 Tajikistan
-
 Tanzania
-
 Thailand
-
 Trinidad and Tobago
-
 Tunisia
-
 Turkey
-
 UAE
UAE
-
 Uganda
-
 Ukraine
-
 United Kingdom
-
United States
-
 Uruguay
-
 Uzbekistan
-
 Venezuela
-
 Vietnam
-
 Yemen
Yemen
-
 Zambia
-
 Zimbabwe
- Forex
- Crypto
