
Ethena sinks 7.58% as oversold signals intensify with sellers in control

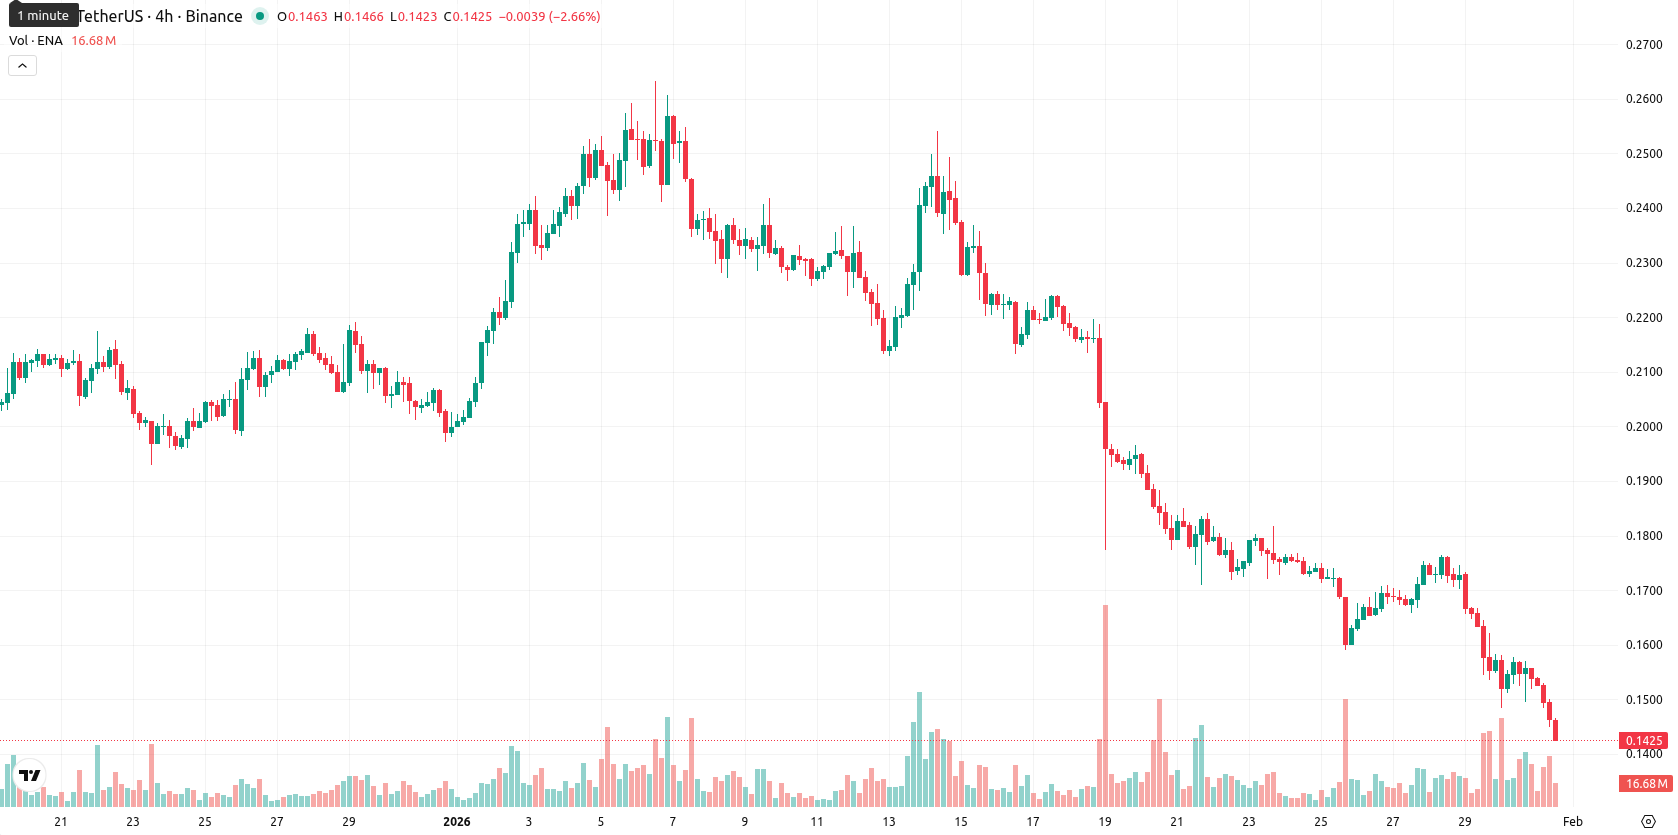
Ethena (ENA) is trading at $0.1439, posting a decisive daily drop of 7.58%. The asset now sits below the MA-20 ($0.1929), MA-50 ($0.2100), and MA-200 ($0.4359), confirming persistent downside pressure across short, medium, and long-term trends.
Highlights
- ENA trades at $0.1439, below MA-20 ($0.1929), MA-50 ($0.2100), and MA-200 ($0.4359), confirming entrenched short-, medium-, and long-term downside trends.
- Daily momentum indicators—including MACD, ADX, RSI, and CCI—are all firmly negative or oversold, underscoring persistent seller dominance and pronounced intraday weakness.
- ENA is expected to range between $0.1300 and $0.1600 over the next five days, with significant resistance at $0.1600 and high probability of further downside.
Oversold signals and seller dominance reinforce intraday downside risk
Momentum remains clearly negative on the daily chart, as both MACD and ADX point to sustained downside strength. The RSI and Commodity Channel Index are now firmly in oversold territory, while the Stochastic RSI also signals an established oversold condition. Bull/Bear Power indicates that sellers continue to dominate intraday momentum. The Awesome Oscillator aligns with the daily downtrend. Price is trading near the session low of $0.1446, underlining high intraday volatility and persistent selling pressure after the open. All momentum and oscillator indicators reinforce pronounced intraday weakness. The nearest dynamic resistance is at the Ichimoku Kijun level of $0.2059.
Consolidation likely as further losses outpace upside scenarios
Over the next five days, ENA is likely to fluctuate within a volatility band of $0.1300 to $0.1600, with further downside more probable and a less than 20% chance of a price increase. The typical scenario is for prices to consolidate in a sideways pattern below resistance, unless a bullish breakout above $0.1600 occurs which might open the way to $0.1700. If downward momentum persists, a dip below $0.1400 could expose further tests of the $0.1300 zone.
Previously it was reported that Ethena (ENA) is exhibiting sustained bearish momentum, trading significantly below its key moving averages with strong resistance at the Ichimoku Kijun and a lack of immediate support. Momentum indicators, including MACD and RSI, signal continued seller dominance and oversold conditions, limiting near-term recovery prospects barring a decisive breakout above resistance.


Latest Ethena News


-
 Afghanistan
-
 Albania
-
 Algeria
-
 Angola
-
 Argentina
-
 Armenia
-
 Australia
-
 Austria
-
 Azerbaijan
-
 Bahamas
-
 Bahrain
-
 Bangladesh
-
 Belarus
-
 Belgium
-
 Bolivia
-
 Botswana
-
 Brazil
-
 Brunei
-
 Bulgaria
-
 Cambodia
-
 Cameroon
-
 Canada
-
 Chile
Chile
-
 China
China
-
 Colombia
-
 Congo
Congo
-
 Costa Rica
-
 Cote d'Ivoire
-
 Croatia
-
 Cuba
Cuba
-
 Cyprus
-
 Czechia
-
 DR Congo
-
 Denmark
-
 Dominican Republic
-
 Ecuador
-
 Egypt
Egypt
-
 El Salvador
-
 Estonia
-
 Eswatini
-
 Ethiopia
-
 Finland
-
 France
-
 Georgia
-
 Germany
-
 Ghana
Ghana
-
 Greece
-
 Haiti
Haiti
-
 Hong Kong
-
 Hungary
-
 India
India
-
 Indonesia
-
 Iran, Islamic republic
-
 Iraq
Iraq
-
 Ireland
-
 Israel
-
 Italy
Italy
-
 Jamaica
-
 Japan
Japan
-
 Jordan
-
 Kazakhstan
-
 Kenya
Kenya
-
 Korea
Korea
-
 Kuwait
-
 Kyrgyzstan
-
 Laos
Laos
-
 Latvia
-
 Lebanon
-
 Lesotho
-
 Libya
Libya
-
 Lithuania
-
 Luxembourg
-
 Madagascar
-
 Malaysia
-
 Malta
Malta
-
 Mauritius
-
 Mexico
-
 Moldova
-
 Mongolia
-
 Montenegro
-
 Morocco
-
 Mozambique
-
 Myanmar
-
 Namibia
-
 Nepal
Nepal
-
 Netherlands
-
 New Zealand
-
 Nigeria
-
 North Macedonia
-
 Norway
-
 Oman
Oman
-
 Pakistan
-
 Palestine
-
 Panama
-
 Papua New Guinea
-
 Paraguay
-
 Peru
Peru
-
 Philippines
-
 Poland
-
 Portugal
-
 Puerto Rico
-
 Qatar
Qatar
-
 Reunion
-
 Romania
-
 Rwanda
-
 Saudi Arabia
-
 Serbia
-
 Singapore
-
 Slovakia
-
 Slovenia
-
 Somalia
-
 South Africa
-
 Spain
Spain
-
 Sri Lanka
-
 Sweden
-
 Switzerland
-
 Syria
Syria
-
 Taiwan
-
 Tajikistan
-
 Tanzania
-
 Thailand
-
 Trinidad and Tobago
-
 Tunisia
-
 Turkey
-
 UAE
UAE
-
 Uganda
-
 Ukraine
-
 United Kingdom
-
United States
-
 Uruguay
-
 Uzbekistan
-
 Venezuela
-
 Vietnam
-
 Yemen
Yemen
-
 Zambia
-
 Zimbabwe
- Forex
- Crypto
