

Lido weekly review: up 1.27% but stuck in $0.4000 – $0.4600 range, consolidation seen

Lido (LDO) ended the week at $0.4132, rising $0.0048 or 1.18% over the past seven days. The asset remains below its W1 MA-20 ($0.5251), MA-50 ($0.5629), and MA-200 ($0.8966), highlighting persistent bearish momentum across all key timeframes.
LDO price prediction
Current price:
$0.4299
0.0329
8.29%
Real-time Data
01:40
Daily range
0.4319
 0.4405
0.4405
Weekly range
0.3853
0.4710
0.4710
Loading...
Highlights
- LDO trades below its MA-20 ($0.5251), MA-50 ($0.5629), and MA-200 ($0.8966), confirming sustained bearish momentum on all major timeframes.
- Momentum indicators, including MACD, ADX, and RSI (27.99), indicate deep oversold conditions yet ongoing seller dominance and weak price action.
- The five-day price range is set at $0.4000–$0.4600 with bullish reversal unlikely unless LDO breaks above the $0.5318 Ichimoku Kijun resistance.
Strong bearish momentum this week as technicals confirm seller dominance
On the weekly chart, LDO maintains pronounced weakness with the price trading consistently below the MA-20, MA-50, and MA-200 moving averages. The closest dynamic resistance is the Ichimoku Kijun level at $0.5318. Weekly RSI is deep in oversold territory at 27.99 and momentum oscillators, including the Commodity Channel Index and Awesome Oscillator, confirm strong seller control. Despite a buy signal from the Stochastic RSI, overall technicals remain bearish due to the alignment of moving averages and continued negative readings from ADX and Bull/Bear Power indicators.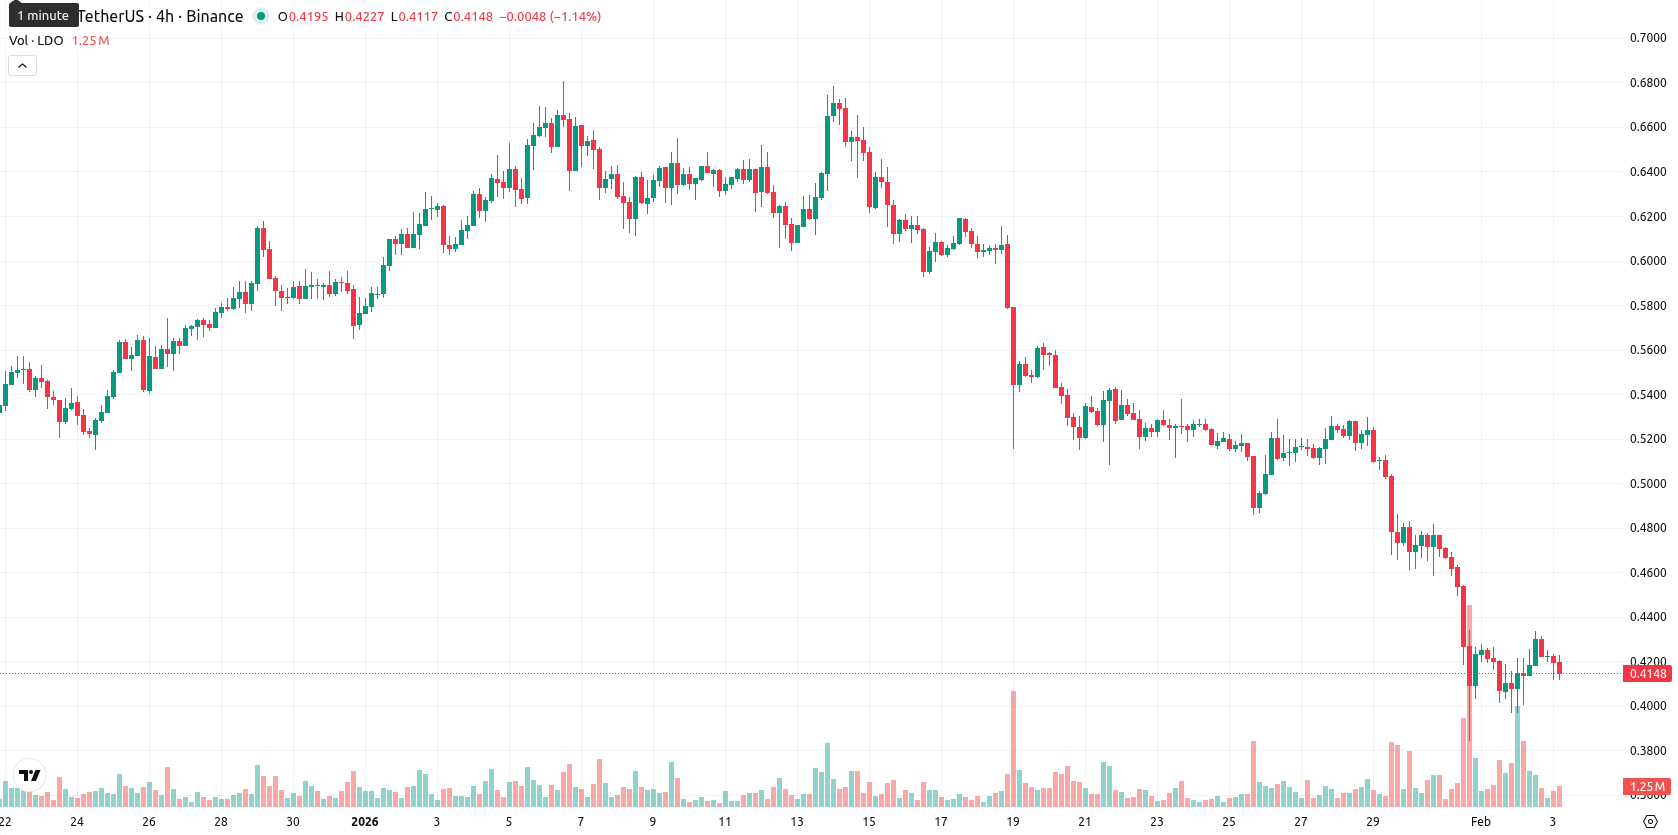
Rangebound outlook next week as technicals cap breakout risks
Looking ahead, LDO is expected to trade within the $0.4000 – $0.4600 range over the next five to seven trading days, with sideways action as the base scenario. Technicals suggest a low probability (under 20%) for a rally above resistance at $0.5318. If bearish pressure continues, a move below $0.4000 is possible, but most signals indicate continued consolidation within the established weekly range.
Anton Kharitonov, analyst at Traders Union, notes that LDO closed this week with a modest gain but remains entrenched in a bearish structure. The price holds below all key weekly moving averages, confirming ongoing seller dominance. Momentum indicators show deep oversold conditions, yet buyers lack strength for a sustained reversal. Kharitonov sees the upcoming week as likely to feature sideways trading within the $0.4000 – $0.4600 band, with little chance for a move above major resistance at $0.5318. He believes bearish momentum remains the primary risk, with technicals not supporting a recovery scenario at this stage. "As long as LDO stays below $0.5318, I don’t see enough evidence to trust any upside for next week."
Previously it was reported that Lido (LDO) is experiencing persistent bearish momentum, with the price currently trading below all major moving averages and technical indicators such as MACD ADX RSI and Stochastic RSI confirming a strong ongoing downtrend despite oversold conditions. Unless LDO breaks above key resistance levels, including the Ichimoku Kijun, the asset is likely to remain rangebound or trend lower amid dominant selling pressure and a high risk of further losses.
Source of Data:
LDO Price Analysis by TU
The analysis is based on a proprietary model combining technical, on-chain, and expert data. Not investment advice. See
methodology
This material may contain third-party opinions, none of the data and information on this webpage constitutes investment advice according to our Disclaimer. While we adhere to strict Editorial Integrity, this post may contain references to products from our partners.
Subscribe to TU news


Did you like the article?





Top News


Top 5 companies for you

United States
-
 Afghanistan
-
 Albania
-
 Algeria
-
 Angola
-
 Argentina
-
 Armenia
-
 Australia
-
 Austria
-
 Azerbaijan
-
 Bahamas
-
 Bahrain
-
 Bangladesh
-
 Belarus
-
 Belgium
-
 Bolivia
-
 Botswana
-
 Brazil
-
 Brunei
-
 Bulgaria
-
 Cambodia
-
 Cameroon
-
 Canada
-
 Chile
Chile
-
 China
China
-
 Colombia
-
 Congo
Congo
-
 Costa Rica
-
 Cote d'Ivoire
-
 Croatia
-
 Cuba
Cuba
-
 Cyprus
-
 Czechia
-
 DR Congo
-
 Denmark
-
 Dominican Republic
-
 Ecuador
-
 Egypt
Egypt
-
 El Salvador
-
 Estonia
-
 Eswatini
-
 Ethiopia
-
 Finland
-
 France
-
 Georgia
-
 Germany
-
 Ghana
Ghana
-
 Greece
-
 Haiti
Haiti
-
 Hong Kong
-
 Hungary
-
 India
India
-
 Indonesia
-
 Iran, Islamic republic
-
 Iraq
Iraq
-
 Ireland
-
 Israel
-
 Italy
Italy
-
 Jamaica
-
 Japan
Japan
-
 Jordan
-
 Kazakhstan
-
 Kenya
Kenya
-
 Korea
Korea
-
 Kuwait
-
 Kyrgyzstan
-
 Laos
Laos
-
 Latvia
-
 Lebanon
-
 Lesotho
-
 Libya
Libya
-
 Lithuania
-
 Luxembourg
-
 Madagascar
-
 Malaysia
-
 Malta
Malta
-
 Mauritius
-
 Mexico
-
 Moldova
-
 Mongolia
-
 Montenegro
-
 Morocco
-
 Mozambique
-
 Myanmar
-
 Namibia
-
 Nepal
Nepal
-
 Netherlands
-
 New Zealand
-
 Nigeria
-
 North Macedonia
-
 Norway
-
 Oman
Oman
-
 Pakistan
-
 Palestine
-
 Panama
-
 Papua New Guinea
-
 Paraguay
-
 Peru
Peru
-
 Philippines
-
 Poland
-
 Portugal
-
 Puerto Rico
-
 Qatar
Qatar
-
 Reunion
-
 Romania
-
 Rwanda
-
 Saudi Arabia
-
 Serbia
-
 Singapore
-
 Slovakia
-
 Slovenia
-
 Somalia
-
 South Africa
-
 Spain
Spain
-
 Sri Lanka
-
 Sweden
-
 Switzerland
-
 Syria
Syria
-
 Taiwan
-
 Tajikistan
-
 Tanzania
-
 Thailand
-
 Trinidad and Tobago
-
 Tunisia
-
 Turkey
-
 UAE
UAE
-
 Uganda
-
 Ukraine
-
 United Kingdom
-
United States
-
 Uruguay
-
 Uzbekistan
-
 Venezuela
-
 Vietnam
-
 Yemen
Yemen
-
 Zambia
-
 Zimbabwe
- Forex
- Crypto










Live News


