
Kaia price prediction: Sideways trend persists as KAIA gains 10.7%

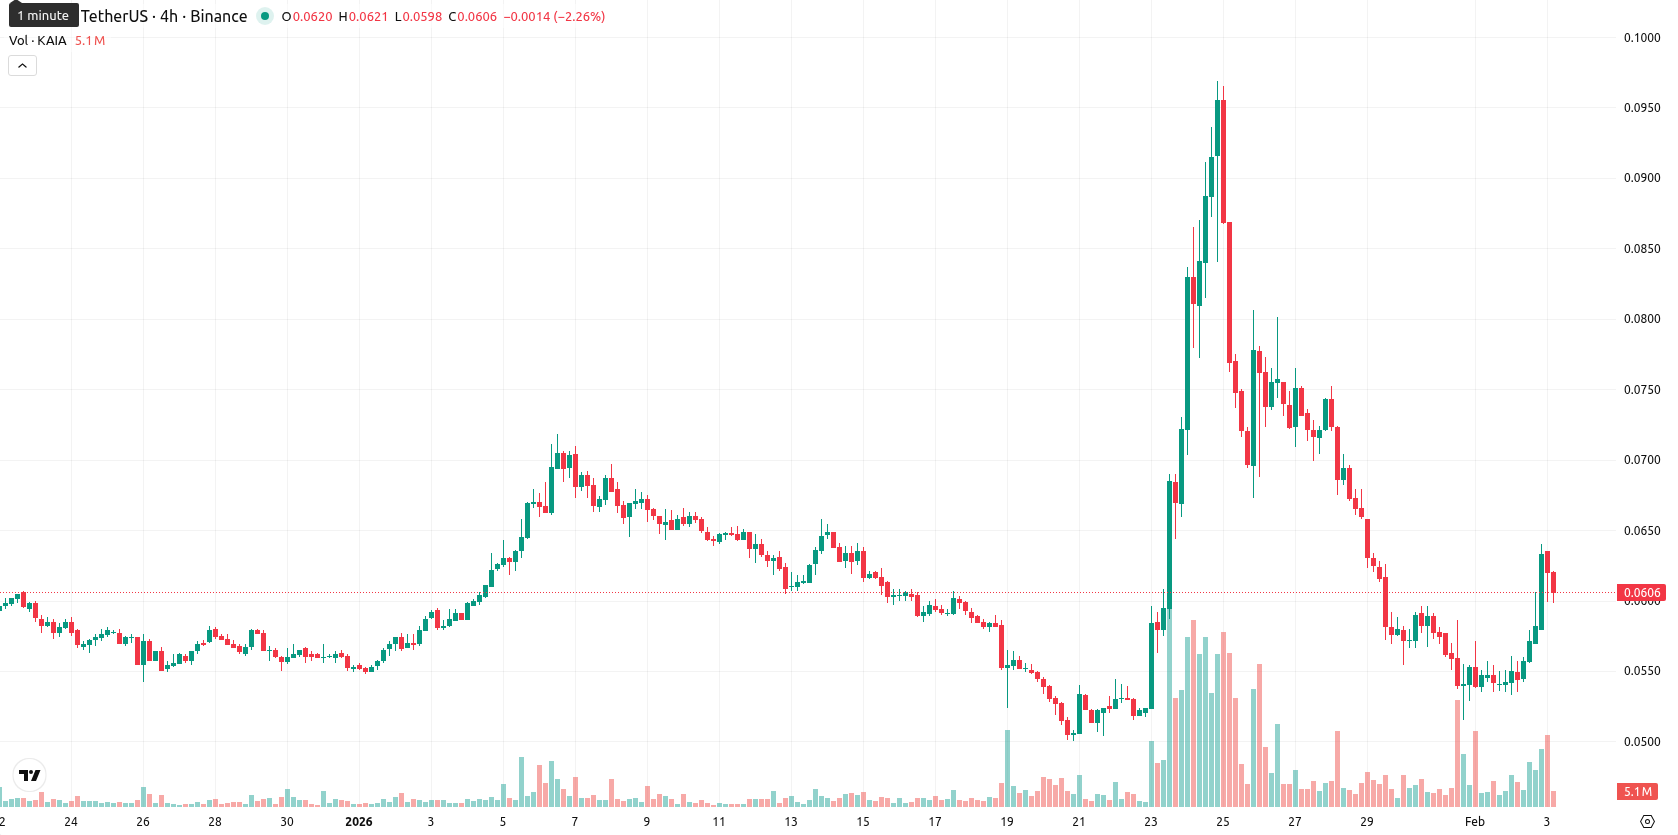
Kaia (KAIA) is trading at $0.0609, marking a moderate daily move within the range of $0.0598 – $0.0634. The asset remains just below its MA-20 ($0.0627) and MA-50 ($0.0619), and significantly under MA-200 ($0.1104), indicating persistent long-term bearish pressure and short- to medium-term resistance.
Highlights
- KAIA is trading at $0.0609, below the MA-20 ($0.0627) and MA-50 ($0.0619), indicating persistent short- and medium-term resistance and overall long-term bearish pressure.
- For the coming week, a sideways price movement in the $0.0580–$0.0645 corridor is the baseline expectation, with less than 20% probability of a significant price increase.
- If KAIA breaks below the $0.0580 support, further declines are likely, while an upside breakout above the MA-20 resistance could initiate a move toward $0.0645.
Mixed signals as trend strength holds amid constrained price action
The nearest resistance for KAIA is the MA-20 at $0.0627, while the Ichimoku Kijun at $0.0735 serves as support but is currently above the price. Short- and medium-term trends remain constrained by the moving averages, with lingering long-term bearish signals. The ADX at 28.84 indicates active trend strength, while the MACD is neutral and RSI on the daily chart hovers near mid-range at 49.27, reflecting slight selling pressure. Stochastic RSI skewed mildly bullish and CCI staying neutral, together with Bull/Bear Power pointing to modest buyer dominance intraday, present a mixed technical picture amid moderate volatility and lack of follow-through after the recent gap up.
Sideways scenario likely as upside break faces resistance
Over the coming week, KAIA is likely to trade within a typical volatility band between $0.0580 and $0.0645. The probability of a price increase remains low, with the baseline scenario being sideways movement inside this range. A breakout above MA-20 resistance could open a move toward the upper band, while a drop below $0.0580 would reinforce the prevailing long-term bearish trend.
Last time, analysts noted that Kaia (KAIA) advanced after a daily gain yet remains below key moving averages, facing immediate resistance near the MA-50 with momentum and oscillators signaling mixed to slightly bearish sentiment. Despite recent buyer activity and high volatility, ongoing consolidation and lack of strength in indicators such as RSI and MACD highlight persistent downside risk absent new positive catalysts.


-
 Afghanistan
-
 Albania
-
 Algeria
-
 Angola
-
 Argentina
-
 Armenia
-
 Australia
-
 Austria
-
 Azerbaijan
-
 Bahamas
-
 Bahrain
-
 Bangladesh
-
 Belarus
-
 Belgium
-
 Bolivia
-
 Botswana
-
 Brazil
-
 Brunei
-
 Bulgaria
-
 Cambodia
-
 Cameroon
-
 Canada
-
 Chile
Chile
-
 China
China
-
 Colombia
-
 Congo
Congo
-
 Costa Rica
-
 Cote d'Ivoire
-
 Croatia
-
 Cuba
Cuba
-
 Cyprus
-
 Czechia
-
 DR Congo
-
 Denmark
-
 Dominican Republic
-
 Ecuador
-
 Egypt
Egypt
-
 El Salvador
-
 Estonia
-
 Eswatini
-
 Ethiopia
-
 Finland
-
 France
-
 Georgia
-
 Germany
-
 Ghana
Ghana
-
 Greece
-
 Haiti
Haiti
-
 Hong Kong
-
 Hungary
-
 India
India
-
 Indonesia
-
 Iran, Islamic republic
-
 Iraq
Iraq
-
 Ireland
-
 Israel
-
 Italy
Italy
-
 Jamaica
-
 Japan
Japan
-
 Jordan
-
 Kazakhstan
-
 Kenya
Kenya
-
 Korea
Korea
-
 Kuwait
-
 Kyrgyzstan
-
 Laos
Laos
-
 Latvia
-
 Lebanon
-
 Lesotho
-
 Libya
Libya
-
 Lithuania
-
 Luxembourg
-
 Madagascar
-
 Malaysia
-
 Malta
Malta
-
 Mauritius
-
 Mexico
-
 Moldova
-
 Mongolia
-
 Montenegro
-
 Morocco
-
 Mozambique
-
 Myanmar
-
 Namibia
-
 Nepal
Nepal
-
 Netherlands
-
 New Zealand
-
 Nigeria
-
 North Macedonia
-
 Norway
-
 Oman
Oman
-
 Pakistan
-
 Palestine
-
 Panama
-
 Papua New Guinea
-
 Paraguay
-
 Peru
Peru
-
 Philippines
-
 Poland
-
 Portugal
-
 Puerto Rico
-
 Qatar
Qatar
-
 Reunion
-
 Romania
-
 Rwanda
-
 Saudi Arabia
-
 Serbia
-
 Singapore
-
 Slovakia
-
 Slovenia
-
 Somalia
-
 South Africa
-
 Spain
Spain
-
 Sri Lanka
-
 Sweden
-
 Switzerland
-
 Syria
Syria
-
 Taiwan
-
 Tajikistan
-
 Tanzania
-
 Thailand
-
 Trinidad and Tobago
-
 Tunisia
-
 Turkey
-
 UAE
UAE
-
 Uganda
-
 Ukraine
-
 United Kingdom
-
United States
-
 Uruguay
-
 Uzbekistan
-
 Venezuela
-
 Vietnam
-
 Yemen
Yemen
-
 Zambia
-
 Zimbabwe
- Forex
- Crypto
