
Technical oversold signals emerge — Pendle drops 7.08%

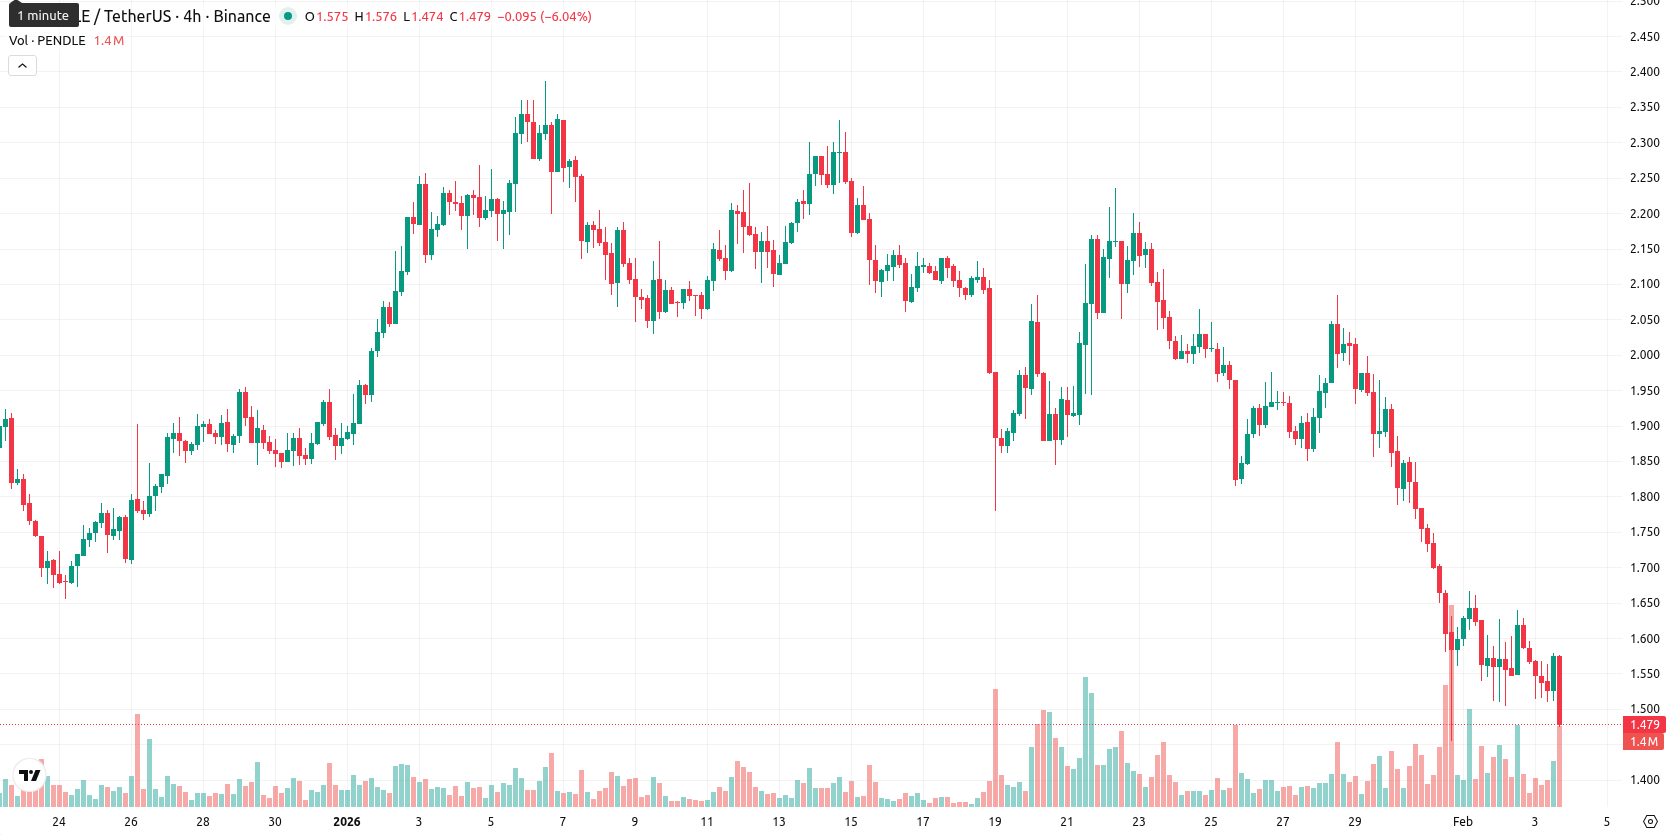
Pendle (PENDLE) is trading at $1.482, reflecting a 7.08% drop for the day and staying well below its short-, medium-, and long-term moving averages (MA-20 at $1.9421, MA-50 at $1.9732, and MA-200 at $3.4499). The asset's position under all major moving averages confirms sustained downside pressure.
Highlights
- Pendle (PENDLE) is trading at $1.482, well below its MA-20 ($1.9421), MA-50 ($1.9732), and MA-200 ($3.4499), confirming sustained downward pressure across all timeframes.
- Momentum indicators including MACD, RSI, CCI, and Stochastic RSI signal a strong bearish bias, with all showing oversold conditions and reduced likelihood of a short-term reversal.
- The expected five-day trading range is $1.34–$1.55 with less than 20% probability of a price recovery; a bearish scenario could push price below $1.34 if oversold signals fail to trigger a rebound.
Bearish momentum persists as oscillators enter oversold territory
Momentum readings remain bearish for PENDLE, with indicators such as the MACD signaling continued downside and the ADX at 17.21 pointing to a weak but persistent trend. Multiple oscillators — including RSI, CCI, and Stochastic RSI — are now in oversold territory, suggesting sellers may be showing short-term exhaustion, though a reversal is not yet signaled. Bull/Bear Power is negative, reflecting continued dominance by sellers intraday, while the Awesome Oscillator supports this pattern. The nearest resistance for Pendle is the Ichimoku Kijun at $1.8930, while support will be defined by intraday lows, given the absence of significant moving average support nearby.
Limited recovery prospects as volatility restrains trading range
For the next five sessions, trading is likely to be confined within the $1.34 – $1.55 volatility band relative to current levels, as oversold conditions and recent momentum may prompt temporary stabilization. The probability of a sharp recovery remains low (below 20%), and further declines are possible if buyers remain sidelined. A decisive move above $1.55, with improvement in momentum indicators, is required to change the trend, while a failure to hold $1.34 could trigger additional downside.
Previously it was reported that Pendle continues to trade well below its short-, medium-, and long-term moving averages, with the price closing at the bottom of its daily range and sellers firmly in control following heightened volatility. Technical momentum indicators, including MACD, ADX, and RSI, confirm persistent bearish pressure and oversold conditions, with the nearest resistance at the Ichimoku Kijun where further selling is expected on any rebound.


-
 Afghanistan
-
 Albania
-
 Algeria
-
 Angola
-
 Argentina
-
 Armenia
-
 Australia
-
 Austria
-
 Azerbaijan
-
 Bahamas
-
 Bahrain
-
 Bangladesh
-
 Belarus
-
 Belgium
-
 Bolivia
-
 Botswana
-
 Brazil
-
 Brunei
-
 Bulgaria
-
 Cambodia
-
 Cameroon
-
 Canada
-
 Chile
Chile
-
 China
China
-
 Colombia
-
 Congo
Congo
-
 Costa Rica
-
 Cote d'Ivoire
-
 Croatia
-
 Cuba
Cuba
-
 Cyprus
-
 Czechia
-
 DR Congo
-
 Denmark
-
 Dominican Republic
-
 Ecuador
-
 Egypt
Egypt
-
 El Salvador
-
 Estonia
-
 Eswatini
-
 Ethiopia
-
 Finland
-
 France
-
 Georgia
-
 Germany
-
 Ghana
Ghana
-
 Greece
-
 Haiti
Haiti
-
 Hong Kong
-
 Hungary
-
 India
India
-
 Indonesia
-
 Iran, Islamic republic
-
 Iraq
Iraq
-
 Ireland
-
 Israel
-
 Italy
Italy
-
 Jamaica
-
 Japan
Japan
-
 Jordan
-
 Kazakhstan
-
 Kenya
Kenya
-
 Korea
Korea
-
 Kuwait
-
 Kyrgyzstan
-
 Laos
Laos
-
 Latvia
-
 Lebanon
-
 Lesotho
-
 Libya
Libya
-
 Lithuania
-
 Luxembourg
-
 Madagascar
-
 Malaysia
-
 Malta
Malta
-
 Mauritius
-
 Mexico
-
 Moldova
-
 Mongolia
-
 Montenegro
-
 Morocco
-
 Mozambique
-
 Myanmar
-
 Namibia
-
 Nepal
Nepal
-
 Netherlands
-
 New Zealand
-
 Nigeria
-
 North Macedonia
-
 Norway
-
 Oman
Oman
-
 Pakistan
-
 Palestine
-
 Panama
-
 Papua New Guinea
-
 Paraguay
-
 Peru
Peru
-
 Philippines
-
 Poland
-
 Portugal
-
 Puerto Rico
-
 Qatar
Qatar
-
 Reunion
-
 Romania
-
 Rwanda
-
 Saudi Arabia
-
 Serbia
-
 Singapore
-
 Slovakia
-
 Slovenia
-
 Somalia
-
 South Africa
-
 Spain
Spain
-
 Sri Lanka
-
 Sweden
-
 Switzerland
-
 Syria
Syria
-
 Taiwan
-
 Tajikistan
-
 Tanzania
-
 Thailand
-
 Trinidad and Tobago
-
 Tunisia
-
 Turkey
-
 UAE
UAE
-
 Uganda
-
 Ukraine
-
 United Kingdom
-
United States
-
 Uruguay
-
 Uzbekistan
-
 Venezuela
-
 Vietnam
-
 Yemen
Yemen
-
 Zambia
-
 Zimbabwe
- Forex
- Crypto
