
Pendle price prediction: Bearish momentum persists? PENDLE falls below major averages

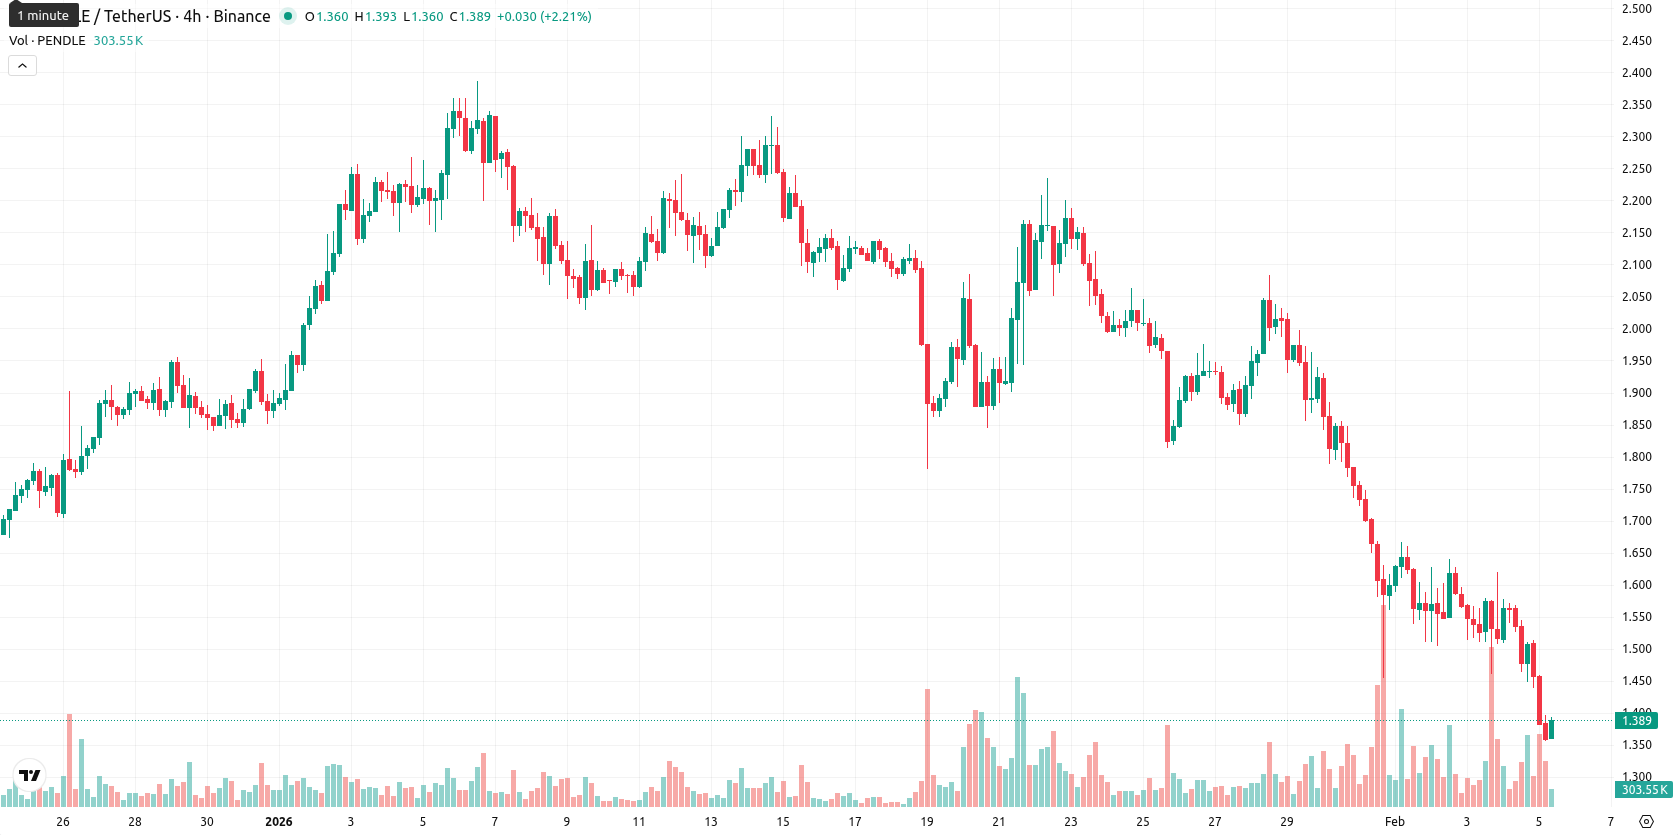
Pendle (PENDLE) is trading at $1.382, which is below the MA-20 ($1.8730), MA-50 ($1.9515), and MA-200 ($3.4201), indicating clear short-, medium-, and long-term bearish pressure. The nearest dynamic resistance is defined by the Ichimoku Kijun at $1.8855, while immediate support can be found near today’s low at $1.355.
Highlights
- PENDLE is trading at $1.382, significantly below its MA-20 ($1.8730), MA-50 ($1.9515), and MA-200 ($3.4201), confirming strong bearish pressure across all timeframes.
- Momentum indicators such as RSI (29.9970), Stochastic RSI (0.0000), CCI (–151.18), and a negative MACD all show the market remains deeply oversold, with sellers dominating.
- Near-term support lies at $1.355 with dynamic resistance at the Ichimoku Kijun ($1.8855); the next five-day range is expected between $1.320 and $1.520, with under 20% probability of an upside move.
Weak momentum and oversold signals drive intraday downside
Momentum indicators confirm a bearish environment, with the MACD and ADX both pointing to weak and negative momentum on the daily timeframe. The RSI (29.9970), Stochastic RSI (0.0000), and CCI (–151.18) all indicate the market is oversold, but Bull/Bear Power remains negative, suggesting sellers continue to dominate. The Awesome Oscillator also aligns with the downtrend. There was a modest gap down from the previous close ($1.555) to the open ($1.458), and the price now sits near the day’s low in a high-volatility session, with clear downside pressure evident throughout the trading day. Momentum and intraday performance both clearly reinforce the prevailing bearish tone; there is no notable divergence among oscillators.
Downside risk dominates outlook as trend signals remain negative
For the next five trading days, the expected range is adjusted to $1.320 – $1.520, centering on the current price while respecting typical volatility for this asset class. The probability of a price increase is very low (less than 20%), with a price decline much more likely given all key D1 and W1 trend and momentum indicators are set to “Sell” or “Strong Sell.” The baseline scenario is that PENDLE consolidates between these levels in a sideways corridor. A bullish scenario would require a decisive breakout above the Ichimoku resistance near $1.8855, while a bearish scenario involves a new breakdown below $1.355, which could trigger further selling.
Previously it was reported that Pendle (PENDLE) is trading well below all major moving averages, with strong selling pressure reflected in both short- and long-term trend signals and no significant nearby support levels. Momentum indicators, including oversold RSI, declining MACD, and persistent bearish signals across multiple timeframes, confirm prevailing downside momentum, while resistance remains entrenched near the Ichimoku Kijun line.


-
 Afghanistan
-
 Albania
-
 Algeria
-
 Angola
-
 Argentina
-
 Armenia
-
 Australia
-
 Austria
-
 Azerbaijan
-
 Bahamas
-
 Bahrain
-
 Bangladesh
-
 Belarus
-
 Belgium
-
 Bolivia
-
 Botswana
-
 Brazil
-
 Brunei
-
 Bulgaria
-
 Cambodia
-
 Cameroon
-
 Canada
-
 Chile
Chile
-
 China
China
-
 Colombia
-
 Congo
Congo
-
 Costa Rica
-
 Cote d'Ivoire
-
 Croatia
-
 Cuba
Cuba
-
 Cyprus
-
 Czechia
-
 DR Congo
-
 Denmark
-
 Dominican Republic
-
 Ecuador
-
 Egypt
Egypt
-
 El Salvador
-
 Estonia
-
 Eswatini
-
 Ethiopia
-
 Finland
-
 France
-
 Georgia
-
 Germany
-
 Ghana
Ghana
-
 Greece
-
 Haiti
Haiti
-
 Hong Kong
-
 Hungary
-
 India
India
-
 Indonesia
-
 Iran, Islamic republic
-
 Iraq
Iraq
-
 Ireland
-
 Israel
-
 Italy
Italy
-
 Jamaica
-
 Japan
Japan
-
 Jordan
-
 Kazakhstan
-
 Kenya
Kenya
-
 Korea
Korea
-
 Kuwait
-
 Kyrgyzstan
-
 Laos
Laos
-
 Latvia
-
 Lebanon
-
 Lesotho
-
 Libya
Libya
-
 Lithuania
-
 Luxembourg
-
 Madagascar
-
 Malaysia
-
 Malta
Malta
-
 Mauritius
-
 Mexico
-
 Moldova
-
 Mongolia
-
 Montenegro
-
 Morocco
-
 Mozambique
-
 Myanmar
-
 Namibia
-
 Nepal
Nepal
-
 Netherlands
-
 New Zealand
-
 Nigeria
-
 North Macedonia
-
 Norway
-
 Oman
Oman
-
 Pakistan
-
 Palestine
-
 Panama
-
 Papua New Guinea
-
 Paraguay
-
 Peru
Peru
-
 Philippines
-
 Poland
-
 Portugal
-
 Puerto Rico
-
 Qatar
Qatar
-
 Reunion
-
 Romania
-
 Rwanda
-
 Saudi Arabia
-
 Serbia
-
 Singapore
-
 Slovakia
-
 Slovenia
-
 Somalia
-
 South Africa
-
 Spain
Spain
-
 Sri Lanka
-
 Sweden
-
 Switzerland
-
 Syria
Syria
-
 Taiwan
-
 Tajikistan
-
 Tanzania
-
 Thailand
-
 Trinidad and Tobago
-
 Tunisia
-
 Turkey
-
 UAE
UAE
-
 Uganda
-
 Ukraine
-
 United Kingdom
-
United States
-
 Uruguay
-
 Uzbekistan
-
 Venezuela
-
 Vietnam
-
 Yemen
Yemen
-
 Zambia
-
 Zimbabwe
- Forex
- Crypto
