
Bitcoin drops 9.08% as price remains below major moving averages and bearish signals persist – weekly outlook

Bitcoin (BTC) started the week at $66,408.11 and ended at $70,161.51, gaining $3,753.40 or 5.65% over the last seven days. The price remains firmly below the weekly MA-20 ($83,600.02), MA-50 ($87,758.35), and MA-200 ($102,806.36), signaling continued weakness relative to major trend benchmarks.
BTC price prediction
Current price:
$ 64676.95
428.41
0.67%
Real-time Data
15:12
Daily range
64293.81
 64774.27
Weekly range
63100.00
66956.15
Loading...
Highlights
- Bitcoin trades at $70,161.51, significantly below its MA-20 ($83,600.02), MA-50 ($87,758.35), and MA-200 ($102,806.36), indicating established downward pressure across timeframes.
- Momentum signals including MACD, ADX, and Awesome Oscillator confirm a bearish tone, with additional selling dominance reflected in Bull/Bear Power and oversold readings in RSI and Stochastic RSI.
- The anticipated five-day trading range is $67,000 to $73,000; strong resistance sits at $73,000 while a breakdown below $67,000 remains plausible if selling continues.
Volatility rises this week on ETF outflows and miner selling
Heavy liquidations totaling about $2.6 billion and outflows from spot Bitcoin ETFs have driven recent market volatility, signaling waning institutional demand. Bitcoin miner reserves declined to approximately 1.806 million BTC, as mining entities increased selling activity. Expiring options worth $2.1 billion have also shifted attention to key support levels.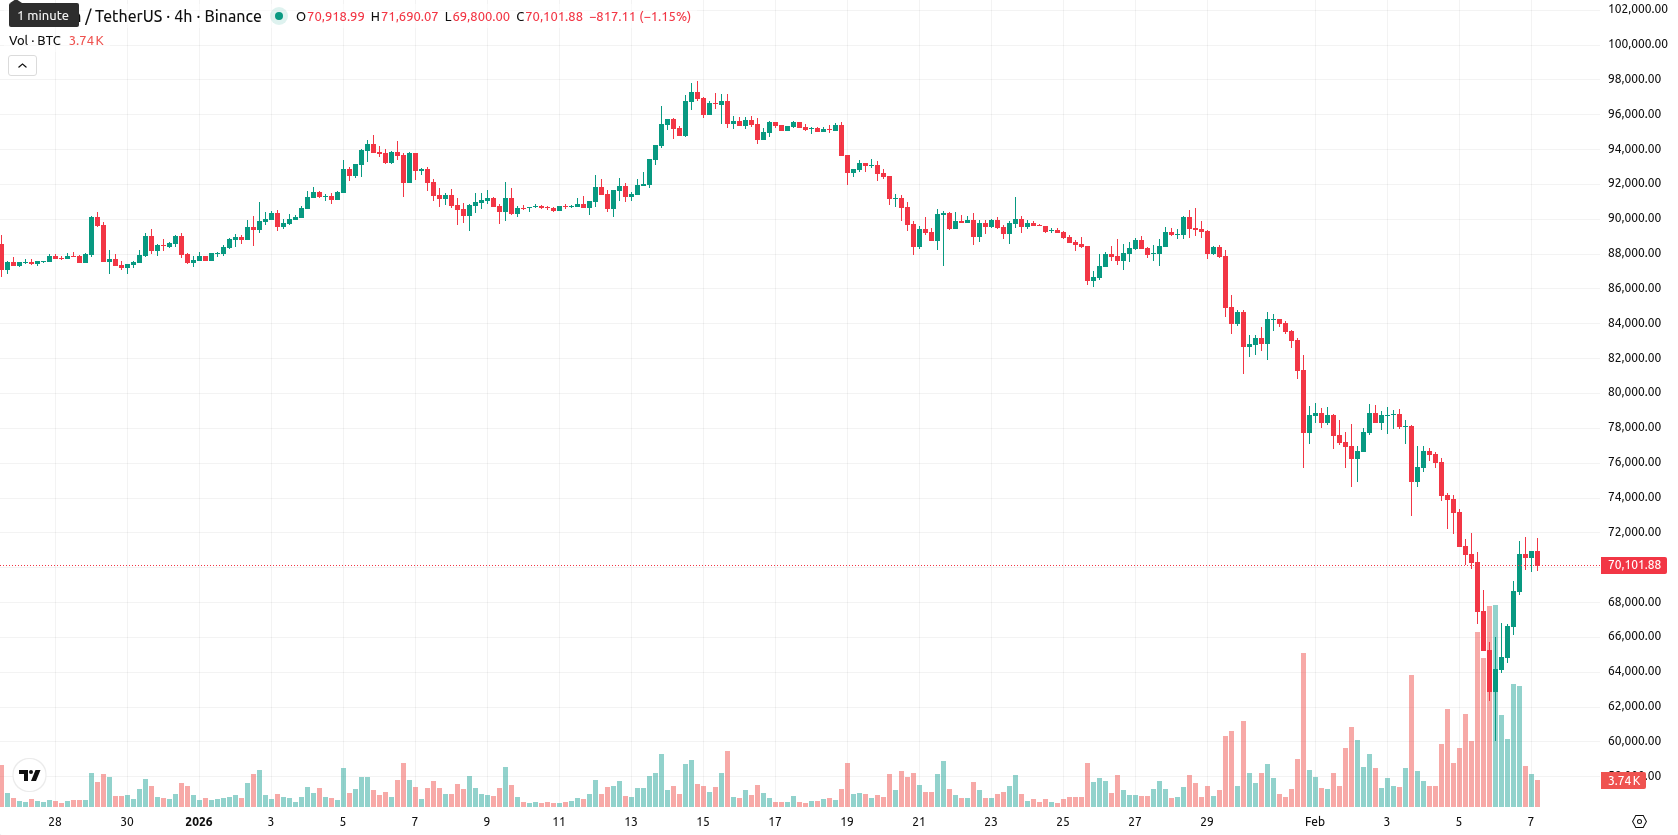
Downtrend confirmed over the week as technicals turn bearish
On the weekly timeframe, Bitcoin remains in a clear downtrend with the current price trading under all major MAs: MA-20 at $83,600.02, MA-50 at $87,758.35, and MA-200 at $102,806.36. The Ichimoku Kijun at $79,189.15 acts as dynamic resistance above the prevailing price action. Weekly technical indicators are predominantly bearish: both MACD and ADX indicate selling strength, while RSI, Stochastic RSI, and CCI register oversold conditions. The Bull/Bear Power metric and negative Awesome Oscillator readings further confirm dominant selling pressure.Sideways bias expected this week amid persistent selling pressure
Looking ahead, the weekly forecast anticipates Bitcoin trading between $67,000 and $73,000 over the next 5–7 trading days, as volatility remains elevated. Bearish momentum in all major weekly indicators, along with the price holding below key trend levels, suggests a low probability—less than 20%—for a sustained rebound. The most likely scenario is continued sideways action with possible retests of support near $67,000 and resistance around $73,000. Strong resistance suggests that further declines are possible if selling persists, while only a decisive break above $73,000 would signal a potential bullish reversal.
Viktoras Karapetjanc, macro and sentiment analyst at Traders Union, sees Bitcoin demonstrating resilience this week with a 5.65% gain despite strong selling pressure and elevated volatility. He notes that macro drivers such as ETF outflows and miner distribution have yet to reverse the overall bullish thesis, though institutional sentiment remains cautious. The analyst highlights that momentum is still bearish on key weekly charts, but structural supports near $67,000 have held so far. Karapetjanc is optimistic that market stability around current levels provides several tactical opportunities for forward-looking traders. "While weekly indicators are still under pressure, I see the potential for a bullish turn if Bitcoin decisively moves above $73,000 — watch for improved sentiment and renewed buying interest in the coming week."
Previously it was reported that Bitcoin is trading well below its key moving averages with sustained bearish momentum, as indicated by negative MACD, ADX, and oversold RSI and CCI readings, compounded by persistent miner and ETF selling pressures. Support near $70,000 remains critical amid heightened volatility, while resistance is set around $80,200 and the likelihood of a significant upside breakout remains limited in the near term.
Source of Data:
BTC Price Analysis by TU
The analysis is based on a proprietary model combining technical, on-chain, and expert data. Not investment advice. See
methodology
This material may contain third-party opinions, none of the data and information on this webpage constitutes investment advice according to our Disclaimer. While we adhere to strict Editorial Integrity, this post may contain references to products from our partners.
Subscribe to TU news

Did you like the article?


Latest Bitcoin News


Weekly Top Bonuses

Top News


Top 5 companies for you

United States
-
 Afghanistan
-
 Albania
-
 Algeria
-
 Angola
-
 Argentina
-
 Armenia
-
 Australia
-
 Austria
-
 Azerbaijan
-
 Bahamas
-
 Bahrain
-
 Bangladesh
-
 Belarus
-
 Belgium
-
 Bolivia
-
 Botswana
-
 Brazil
-
 Brunei
-
 Bulgaria
-
 Cambodia
-
 Cameroon
-
 Canada
-
 Chile
Chile
-
 China
China
-
 Colombia
-
 Congo
Congo
-
 Costa Rica
-
 Cote d'Ivoire
-
 Croatia
-
 Cuba
Cuba
-
 Cyprus
-
 Czechia
-
 DR Congo
-
 Denmark
-
 Dominican Republic
-
 Ecuador
-
 Egypt
Egypt
-
 El Salvador
-
 Estonia
-
 Eswatini
-
 Ethiopia
-
 Finland
-
 France
-
 Georgia
-
 Germany
-
 Ghana
Ghana
-
 Greece
-
 Haiti
Haiti
-
 Hong Kong
-
 Hungary
-
 India
India
-
 Indonesia
-
 Iran, Islamic republic
-
 Iraq
Iraq
-
 Ireland
-
 Israel
-
 Italy
Italy
-
 Jamaica
-
 Japan
Japan
-
 Jordan
-
 Kazakhstan
-
 Kenya
Kenya
-
 Korea
Korea
-
 Kuwait
-
 Kyrgyzstan
-
 Laos
Laos
-
 Latvia
-
 Lebanon
-
 Lesotho
-
 Libya
Libya
-
 Lithuania
-
 Luxembourg
-
 Madagascar
-
 Malaysia
-
 Malta
Malta
-
 Mauritius
-
 Mexico
-
 Moldova
-
 Mongolia
-
 Montenegro
-
 Morocco
-
 Mozambique
-
 Myanmar
-
 Namibia
-
 Nepal
Nepal
-
 Netherlands
-
 New Zealand
-
 Nigeria
-
 North Macedonia
-
 Norway
-
 Oman
Oman
-
 Pakistan
-
 Palestine
-
 Panama
-
 Papua New Guinea
-
 Paraguay
-
 Peru
Peru
-
 Philippines
-
 Poland
-
 Portugal
-
 Puerto Rico
-
 Qatar
Qatar
-
 Reunion
-
 Romania
-
 Rwanda
-
 Saudi Arabia
-
 Serbia
-
 Singapore
-
 Slovakia
-
 Slovenia
-
 Somalia
-
 South Africa
-
 Spain
Spain
-
 Sri Lanka
-
 Sweden
-
 Switzerland
-
 Syria
Syria
-
 Taiwan
-
 Tajikistan
-
 Tanzania
-
 Thailand
-
 Trinidad and Tobago
-
 Tunisia
-
 Turkey
-
 UAE
UAE
-
 Uganda
-
 Ukraine
-
 United Kingdom
-
United States
-
 Uruguay
-
 Uzbekistan
-
 Venezuela
-
 Vietnam
-
 Yemen
Yemen
-
 Zambia
-
 Zimbabwe
- Forex
- Crypto
Live News
