
XRP price prediction: Sideways risk or rebound after upgrades? XRP gains 10.86%

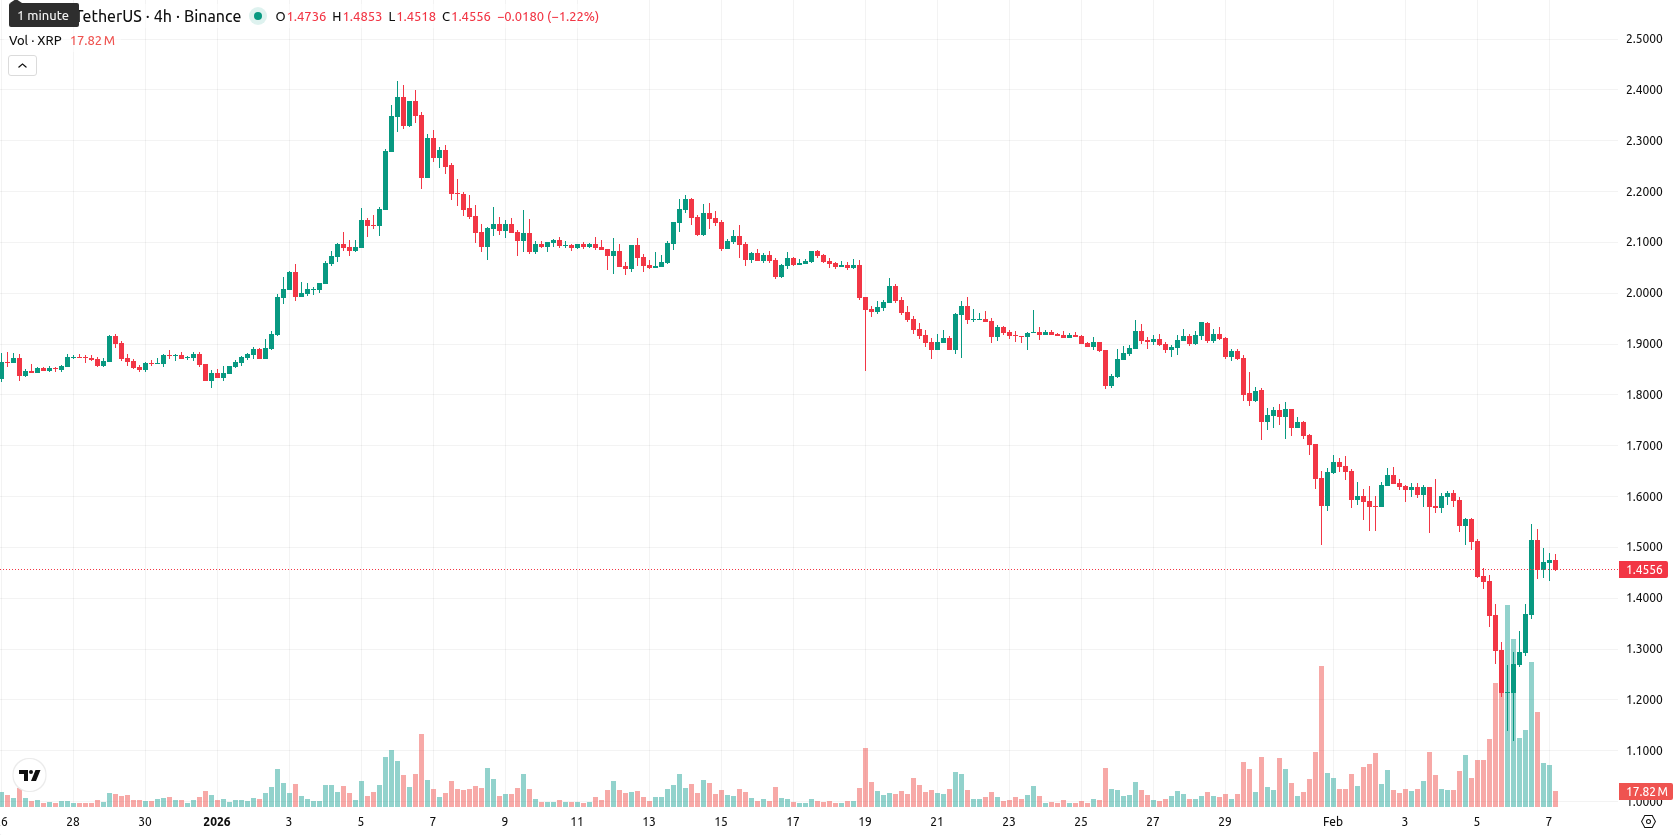
XRP (XRP) is trading at $1.4615, marking a 10.86% daily gain as it remains below the MA-20 at $1.7657, MA-50 at $1.9094, and MA-200 at $2.4656 — signaling persistent bearish pressure across short-, medium-, and long-term timeframes.
Highlights
- Ripple has secured new EU regulatory approvals, expanding its compliance footprint and positioning XRP for broader institutional and enterprise adoption in regulated markets.
- Institutional demand for XRP remains strong as spot ETFs report steady net inflows, and the XRP Ledger upgrade strengthens its appeal for banks and DeFi use cases.
- XRP trades at $1.4615, below key moving averages (MA-20 at $1.7657, MA-50 at $1.9094), with critical support at $1.3400–$1.3600 and resistance at $1.6565.
Institutional inflows rise as EU regulatory wins and tech upgrades boost XRP
Ripple has secured new regulatory approvals in the EU, expanding its compliance footprint, while XRP spot ETFs have experienced steady net inflows reflecting sustained institutional demand. A major upgrade to the XRP Ledger has been activated, enhancing its regulatory alignment and appeal for banks, fintechs, and enterprises involved in DeFi and cross-border payments. XRP’s growing use as collateral in global finance is also gaining momentum due to advances in on-chain derivatives, liquidity solutions, and strategic partnerships.
Weak trend confirmed as indicators diverge and volatility undercuts support
Technically, XRP is trading below key moving averages, with dynamic resistance at the Ichimoku Kijun ($1.6565) and thin support near $1.3400–$1.3600. Momentum signals are mixed: the MACD and ADX confirm a weak to moderate bearish trend, while the RSI and CCI indicate oversold conditions. Bull/Bear Power points to intraday seller dominance, but the Stochastic RSI suggests a strong buy signal, introducing recovery potential. The Awesome Oscillator remains bearish, and current price action shows high volatility and a tilt toward pressure; divergence among oscillators highlights short-term uncertainty.
Downside bias prevails as volatility persists and bullish reversal stalls
XRP is expected to fluctuate within a typical volatility band of $1.3100–$1.6100 over the next five trading days. The odds of a sustained upside are low (less than 20%), and further decline is more likely, with sideways action favored as bears and bargain hunters compete. A breakout above $1.66 could trigger a move toward $1.61 or higher, while failure to hold above $1.34 might bring the lower end of the volatility range into play. Conditions remain fragile, and buyers will need to maintain momentum for a meaningful reversal.
Previously it was reported that XRP continues to trade below its key moving averages, with sustained bearish momentum indicated by the MACD and ADX, while short-term oscillators flag oversold conditions amid heightened volatility. Notable ETF inflows and increased institutional custodial activity contrast with ongoing price pressures, as technicals highlight dynamic resistance near $1.67 and support forming around the $1.40 level.


Latest XRP News


-
 Afghanistan
-
 Albania
-
 Algeria
-
 Angola
-
 Argentina
-
 Armenia
-
 Australia
-
 Austria
-
 Azerbaijan
-
 Bahamas
-
 Bahrain
-
 Bangladesh
-
 Belarus
-
 Belgium
-
 Bolivia
-
 Botswana
-
 Brazil
-
 Brunei
-
 Bulgaria
-
 Cambodia
-
 Cameroon
-
 Canada
-
 Chile
Chile
-
 China
China
-
 Colombia
-
 Congo
Congo
-
 Costa Rica
-
 Cote d'Ivoire
-
 Croatia
-
 Cuba
Cuba
-
 Cyprus
-
 Czechia
-
 DR Congo
-
 Denmark
-
 Dominican Republic
-
 Ecuador
-
 Egypt
Egypt
-
 El Salvador
-
 Estonia
-
 Eswatini
-
 Ethiopia
-
 Finland
-
 France
-
 Georgia
-
 Germany
-
 Ghana
Ghana
-
 Greece
-
 Haiti
Haiti
-
 Hong Kong
-
 Hungary
-
 India
India
-
 Indonesia
-
 Iran, Islamic republic
-
 Iraq
Iraq
-
 Ireland
-
 Israel
-
 Italy
Italy
-
 Jamaica
-
 Japan
Japan
-
 Jordan
-
 Kazakhstan
-
 Kenya
Kenya
-
 Korea
Korea
-
 Kuwait
-
 Kyrgyzstan
-
 Laos
Laos
-
 Latvia
-
 Lebanon
-
 Lesotho
-
 Libya
Libya
-
 Lithuania
-
 Luxembourg
-
 Madagascar
-
 Malaysia
-
 Malta
Malta
-
 Mauritius
-
 Mexico
-
 Moldova
-
 Mongolia
-
 Montenegro
-
 Morocco
-
 Mozambique
-
 Myanmar
-
 Namibia
-
 Nepal
Nepal
-
 Netherlands
-
 New Zealand
-
 Nigeria
-
 North Macedonia
-
 Norway
-
 Oman
Oman
-
 Pakistan
-
 Palestine
-
 Panama
-
 Papua New Guinea
-
 Paraguay
-
 Peru
Peru
-
 Philippines
-
 Poland
-
 Portugal
-
 Puerto Rico
-
 Qatar
Qatar
-
 Reunion
-
 Romania
-
 Rwanda
-
 Saudi Arabia
-
 Serbia
-
 Singapore
-
 Slovakia
-
 Slovenia
-
 Somalia
-
 South Africa
-
 Spain
Spain
-
 Sri Lanka
-
 Sweden
-
 Switzerland
-
 Syria
Syria
-
 Taiwan
-
 Tajikistan
-
 Tanzania
-
 Thailand
-
 Trinidad and Tobago
-
 Tunisia
-
 Turkey
-
 UAE
UAE
-
 Uganda
-
 Ukraine
-
 United Kingdom
-
United States
-
 Uruguay
-
 Uzbekistan
-
 Venezuela
-
 Vietnam
-
 Yemen
Yemen
-
 Zambia
-
 Zimbabwe
- Forex
- Crypto
