
Intraday volatility hits highs — VeChain gains 7.76%

VeChain (VET) is trading at $0.008028, positioned below the MA-20 ($0.008829), MA-50 ($0.01034360), and MA-200 ($0.01707055), signaling persistent downside pressure in short-, medium-, and long-term trends.
Highlights
- VeChain (VET) is trading at $0.008028, below the MA-20 ($0.008829), MA-50 ($0.01034360), and MA-200 ($0.01707055), confirming multi-timeframe downside pressure.
- Daily momentum indicators remain bearish, with MACD, ADX, and Bull/Bear Power signaling strong seller control, while RSI at 31.8 and CCI at -90 suggest near-oversold conditions.
- VET's expected five-day trading corridor is $0.00730–$0.00880; a break above $0.00940 may signal bullish reversal, while sub-$0.00730 opens risk for further declines.
Bearish momentum persists as intraday strength tests resistance
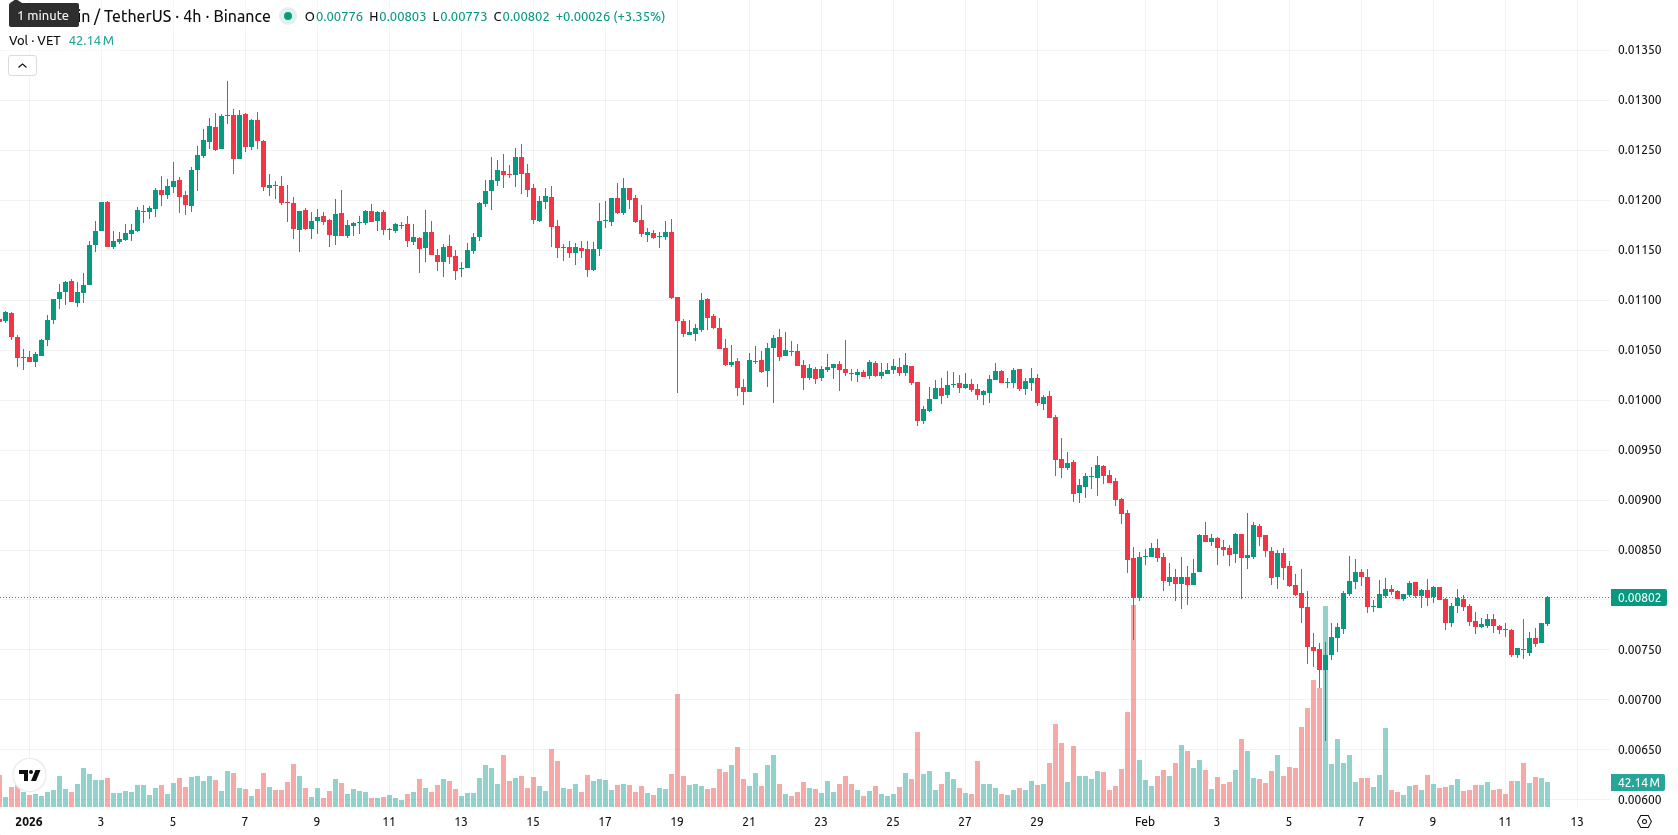
The nearest dynamic resistance on the daily chart is set by the Ichimoku Kijun at $0.009400, with no major support level from Ichimoku currently nearby. Momentum on the daily timeframe remains bearish, as both MACD and ADX indicate seller control, while RSI at 31.8 and CCI at -90 suggest the market is near oversold territory. Despite a daily gain of 7.76%, Bull/Bear Power also points to sellers dominating, and the Stochastic RSI signals a potential short-term bounce as it returns above 50. There was no opening gap between the previous close ($0.00745) and today’s open ($0.00757); the current price is trading just above the high of today’s range, reflecting high intraday volatility and strength toward session highs. However, the divergence between intraday oscillator buy signals and overall bearish momentum suggests today’s rally could face resistance from prevailing downtrend forces.
Sideways trading likely as bearish signals and volatility dominate
Looking ahead, the expected short-term price corridor for the next five trading days is between $0.00730 and $0.00880, recalibrated for current volatility and market structure. The probability of a price increase is very low (less than 20%), with further downside more likely given the persistent sell forecasts from weekly and daily trend indicators. In the baseline scenario, VET will likely move sideways within this corridor. A bullish scenario would require a decisive break above $0.00940, while a bearish scenario could unfold if the price falls below $0.00730, targeting further support below that level.
Last time, analysts noted that VeChain remains under heavy bearish pressure, trading significantly below its major moving averages on the weekly timeframe with prevailing negative momentum and no immediate technical support. Key indicators such as RSI, MACD, ADX, and CCI point to continued selling dominance, suggesting the asset is likely to remain rangebound with low upside breakout risk in the near term.


Latest VeChain News


-
 Afghanistan
-
 Albania
-
 Algeria
-
 Angola
-
 Argentina
-
 Armenia
-
 Australia
-
 Austria
-
 Azerbaijan
-
 Bahamas
-
 Bahrain
-
 Bangladesh
-
 Belarus
-
 Belgium
-
 Bolivia
-
 Botswana
-
 Brazil
-
 Brunei
-
 Bulgaria
-
 Cambodia
-
 Cameroon
-
 Canada
-
 Chile
Chile
-
 China
China
-
 Colombia
-
 Congo
Congo
-
 Costa Rica
-
 Cote d'Ivoire
-
 Croatia
-
 Cuba
Cuba
-
 Cyprus
-
 Czechia
-
 DR Congo
-
 Denmark
-
 Dominican Republic
-
 Ecuador
-
 Egypt
Egypt
-
 El Salvador
-
 Estonia
-
 Eswatini
-
 Ethiopia
-
 Finland
-
 France
-
 Georgia
-
 Germany
-
 Ghana
Ghana
-
 Greece
-
 Haiti
Haiti
-
 Hong Kong
-
 Hungary
-
 India
India
-
 Indonesia
-
 Iran, Islamic republic
-
 Iraq
Iraq
-
 Ireland
-
 Israel
-
 Italy
Italy
-
 Jamaica
-
 Japan
Japan
-
 Jordan
-
 Kazakhstan
-
 Kenya
Kenya
-
 Korea
Korea
-
 Kuwait
-
 Kyrgyzstan
-
 Laos
Laos
-
 Latvia
-
 Lebanon
-
 Lesotho
-
 Libya
Libya
-
 Lithuania
-
 Luxembourg
-
 Madagascar
-
 Malaysia
-
 Malta
Malta
-
 Mauritius
-
 Mexico
-
 Moldova
-
 Mongolia
-
 Montenegro
-
 Morocco
-
 Mozambique
-
 Myanmar
-
 Namibia
-
 Nepal
Nepal
-
 Netherlands
-
 New Zealand
-
 Nigeria
-
 North Macedonia
-
 Norway
-
 Oman
Oman
-
 Pakistan
-
 Palestine
-
 Panama
-
 Papua New Guinea
-
 Paraguay
-
 Peru
Peru
-
 Philippines
-
 Poland
-
 Portugal
-
 Puerto Rico
-
 Qatar
Qatar
-
 Reunion
-
 Romania
-
 Rwanda
-
 Saudi Arabia
-
 Serbia
-
 Singapore
-
 Slovakia
-
 Slovenia
-
 Somalia
-
 South Africa
-
 Spain
Spain
-
 Sri Lanka
-
 Sweden
-
 Switzerland
-
 Syria
Syria
-
 Taiwan
-
 Tajikistan
-
 Tanzania
-
 Thailand
-
 Trinidad and Tobago
-
 Tunisia
-
 Turkey
-
 UAE
UAE
-
 Uganda
-
 Ukraine
-
 United Kingdom
-
United States
-
 Uruguay
-
 Uzbekistan
-
 Venezuela
-
 Vietnam
-
 Yemen
Yemen
-
 Zambia
-
 Zimbabwe
- Forex
- Crypto
