

DeXe price prediction: Bear trend set to continue as DEXE slips 7.44%

DeXe (DEXE) is trading at $2.37, sitting just below the MA-20 ($2.40), well under the MA-50 ($2.92), and far below the MA-200 ($5.71), indicating sustained selling pressure across short, medium, and long-term trends.
DEXE price prediction
Current price:
$1.86
-0.04
1.90%
Real-time Data
13:28
Daily range
1.79
 1.89
1.89
1.89
Weekly range
1.72
1.92
1.92
Loading...
Highlights
- DEXE is trading at $2.37, below MA-20 ($2.40), MA-50 ($2.92), and MA-200 ($5.71), affirming sustained selling pressure across timeframes.
- Momentum signals are sharply negative with daily MACD and ADX flashing Sell, while Stochastic RSI is overbought at 91.28 and RSI at 44.00.
- DEXE will likely consolidate between $2.13–$2.51 in the next five trading days, with over 80% probability of further decline unless $2.46 resistance is breached.
Momentum divergence and intraday stabilization shape consolidation risk
The nearest dynamic resistance is at the Ichimoku Kijun level of $2.46, with support emerging closer to the MA-10 zone, while no golden or death cross is present. Momentum signals are decisively negative, with both the MACD and ADX on the daily timeframe flashing Sell forecasts that confirm a lack of strong bullish conviction. The RSI stands at 44.00 and the Stochastic RSI is deeply overbought at 91.28, hinting that recent declines could pause, though the CCI remains neutral. Bull/Bear Power is in strong buy territory, suggesting that buyers are trying to stabilize prices intraday, yet daily price action is down $0.19 or 7.44%, with the open matching the current price and no apparent gap. The price is holding near the session's low ($2.35 – $2.38) in a narrow, low-volatility range, with continued pressure following the open and oscillators diverging from momentum indicators; this highlights an uncertain, consolidation-prone tone for the session.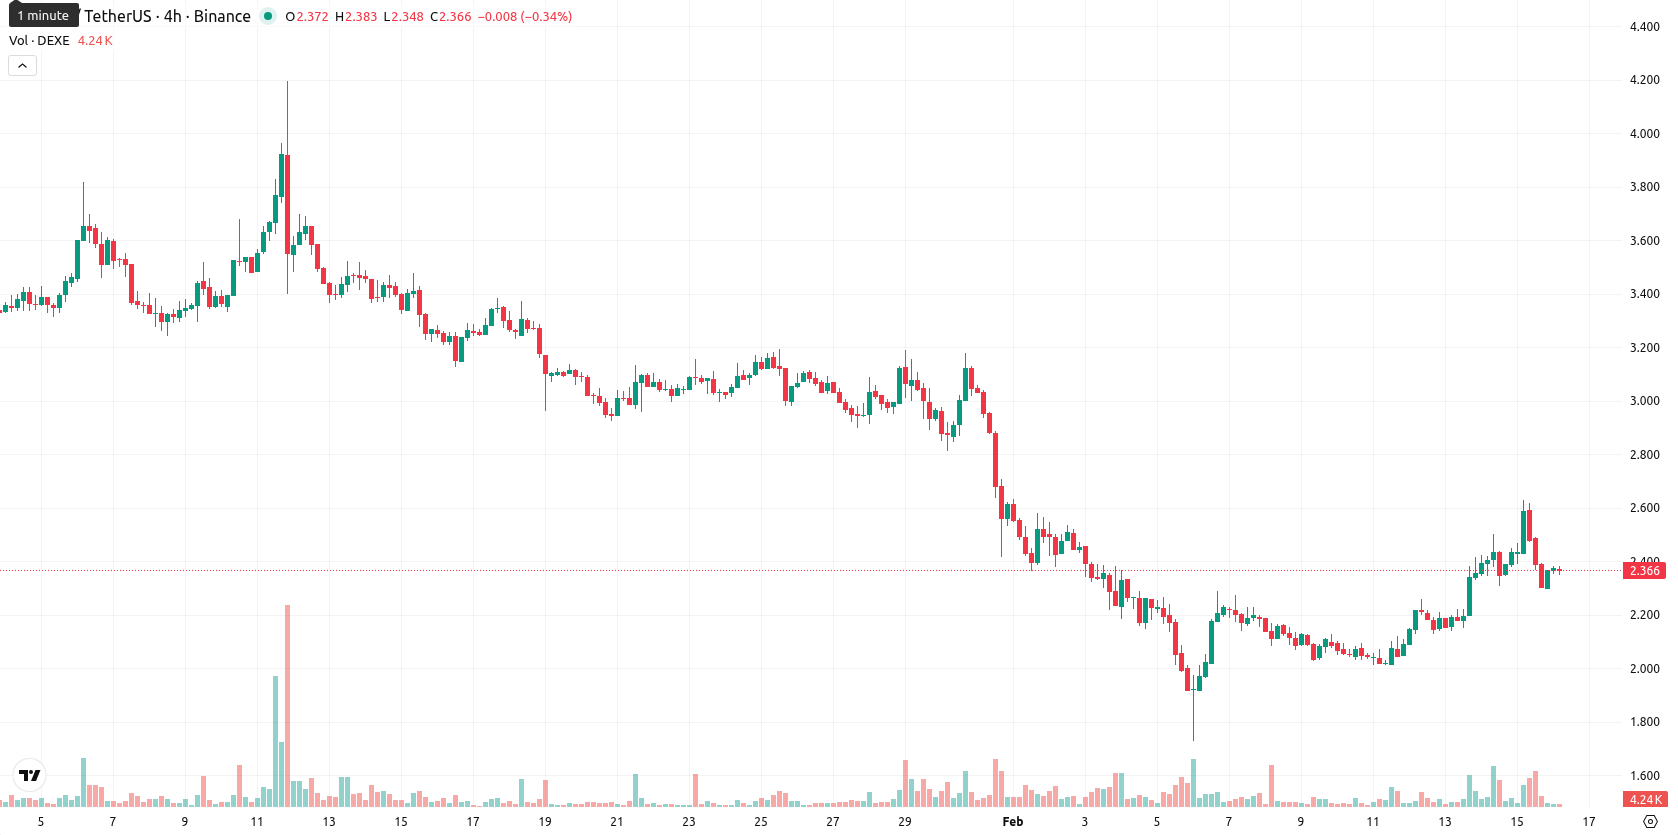
High downside risk as volatility band limits rebound odds
For the next five trading days, DEXE is expected to trade within a typical volatility band between $2.13 and $2.51. The probability of a further price decline is very high (more than 80%), while an upside move is less likely. The base scenario indicates that DEXE continues to consolidate sideways within this corridor, but a break above $2.46 could trigger a move toward the upper band, whereas a drop below $2.13 would confirm a bearish continuation in line with the ongoing longer-term downtrend signals.
Anton Kharitonov, expert at Traders Union, sees no shift in DeXe’s sustained bearish momentum. He remains cautious, pointing out that price action is stuck under every major moving average with negative signals from MACD and ADX. Risks clearly favor downside, with only faint support from select oscillators. "As long as DEXE trades below $2.46, I see little reason to expect a genuine reversal and prefer to stay defensive."
Last time, analysts noted that DeXe is trading above its 20-day moving average but remains below both the 50- and 200-day averages, signaling short-term bullishness within a broader bearish trend. Mixed technical signals—such as a bearish MACD, weak ADX, and overbought Stochastic RSI—suggest the asset may consolidate sideways between support at $2.46 and resistance near $2.80, with limited upside probability in the near term.
Source of Data:
DEXE Price Analysis by TU
The analysis is based on a proprietary model combining technical, on-chain, and expert data. Not investment advice. See
methodology
The information is based on forecasts and does not constitute investment advice or a guarantee of future results. Market conditions may change. See our Disclaimer and Editorial Integrity for details.
Subscribe to TU news


Did you like the article?





Top News


Top 5 companies for you

United States
-
 Afghanistan
-
 Albania
-
 Algeria
-
 Angola
-
 Argentina
-
 Armenia
-
 Australia
-
 Austria
-
 Azerbaijan
-
 Bahamas
-
 Bahrain
-
 Bangladesh
-
 Belarus
-
 Belgium
-
 Bolivia
-
 Botswana
-
 Brazil
-
 Brunei
-
 Bulgaria
-
 Cambodia
-
 Cameroon
-
 Canada
-
 Chile
Chile
-
 China
China
-
 Colombia
-
 Congo
Congo
-
 Costa Rica
-
 Cote d'Ivoire
-
 Croatia
-
 Cuba
Cuba
-
 Cyprus
-
 Czechia
-
 DR Congo
-
 Denmark
-
 Dominican Republic
-
 Ecuador
-
 Egypt
Egypt
-
 El Salvador
-
 Estonia
-
 Eswatini
-
 Ethiopia
-
 Finland
-
 France
-
 Georgia
-
 Germany
-
 Ghana
Ghana
-
 Greece
-
 Haiti
Haiti
-
 Hong Kong
-
 Hungary
-
 India
India
-
 Indonesia
-
 Iran, Islamic republic
-
 Iraq
Iraq
-
 Ireland
-
 Israel
-
 Italy
Italy
-
 Jamaica
-
 Japan
Japan
-
 Jordan
-
 Kazakhstan
-
 Kenya
Kenya
-
 Korea
Korea
-
 Kuwait
-
 Kyrgyzstan
-
 Laos
Laos
-
 Latvia
-
 Lebanon
-
 Lesotho
-
 Libya
Libya
-
 Lithuania
-
 Luxembourg
-
 Madagascar
-
 Malaysia
-
 Malta
Malta
-
 Mauritius
-
 Mexico
-
 Moldova
-
 Mongolia
-
 Montenegro
-
 Morocco
-
 Mozambique
-
 Myanmar
-
 Namibia
-
 Nepal
Nepal
-
 Netherlands
-
 New Zealand
-
 Nigeria
-
 North Macedonia
-
 Norway
-
 Oman
Oman
-
 Pakistan
-
 Palestine
-
 Panama
-
 Papua New Guinea
-
 Paraguay
-
 Peru
Peru
-
 Philippines
-
 Poland
-
 Portugal
-
 Puerto Rico
-
 Qatar
Qatar
-
 Reunion
-
 Romania
-
 Rwanda
-
 Saudi Arabia
-
 Serbia
-
 Singapore
-
 Slovakia
-
 Slovenia
-
 Somalia
-
 South Africa
-
 Spain
Spain
-
 Sri Lanka
-
 Sweden
-
 Switzerland
-
 Syria
Syria
-
 Taiwan
-
 Tajikistan
-
 Tanzania
-
 Thailand
-
 Trinidad and Tobago
-
 Tunisia
-
 Turkey
-
 UAE
UAE
-
 Uganda
-
 Ukraine
-
 United Kingdom
-
United States
-
 Uruguay
-
 Uzbekistan
-
 Venezuela
-
 Vietnam
-
 Yemen
Yemen
-
 Zambia
-
 Zimbabwe
- Forex
- Crypto










Live News


