

Conflicting momentum signals and volatile range — DeXe gains 7.65%

DeXe (DEXE) is currently trading at $2.60 after a 7.65% gain intraday, standing above the MA-20 ($2.44) but below the MA-50 ($2.93) and MA-200 ($5.74). This positions the asset with a short-term bullish bias while remaining in a medium- to long-term bearish context versus its moving averages.
DEXE price prediction
Current price:
$1.85
-0.02
1.28%
Real-time Data
03:55
Daily range
1.85
 1.87
1.87
1.87
Weekly range
1.72
1.92
1.92
Loading...
Highlights
- DEXE trades at $2.60, above the MA-20 ($2.44) but below the MA-50 ($2.93) and MA-200 ($5.74), indicating a short-term bullish move within a broader medium- and long-term bearish structure.
- Momentum indicators diverge: daily MACD is in 'Strong Sell', ADX shows weak trend strength, but Bull/Bear Power signals intraday buyers dominating after a 7.65% gain.
- DEXE is likely to consolidate between $2.35 and $2.80 over the next five sessions, with less than a 20% probability of a price increase and risk of further declines below $2.46.
Conflicting momentum signals as resistance aligns with MA-50
DEXE's technical landscape shows immediate dynamic support near the Ichimoku Kijun at $2.46 and resistance at the MA-50 ($2.93). Daily momentum signals are mixed: the MACD indicates 'Strong Sell', ADX reveals weak trend strength, and the RSI sits just below neutral at 46.17, while the Stochastic RSI is strongly overbought and Bull/Bear Power is in 'Strong Buy' territory. No gap occurred at today’s open, and the price is now trading at the upper end of today’s volatile $2.39 – $2.63 range, but conflicting oscillator signals suggest hesitance above $2.60.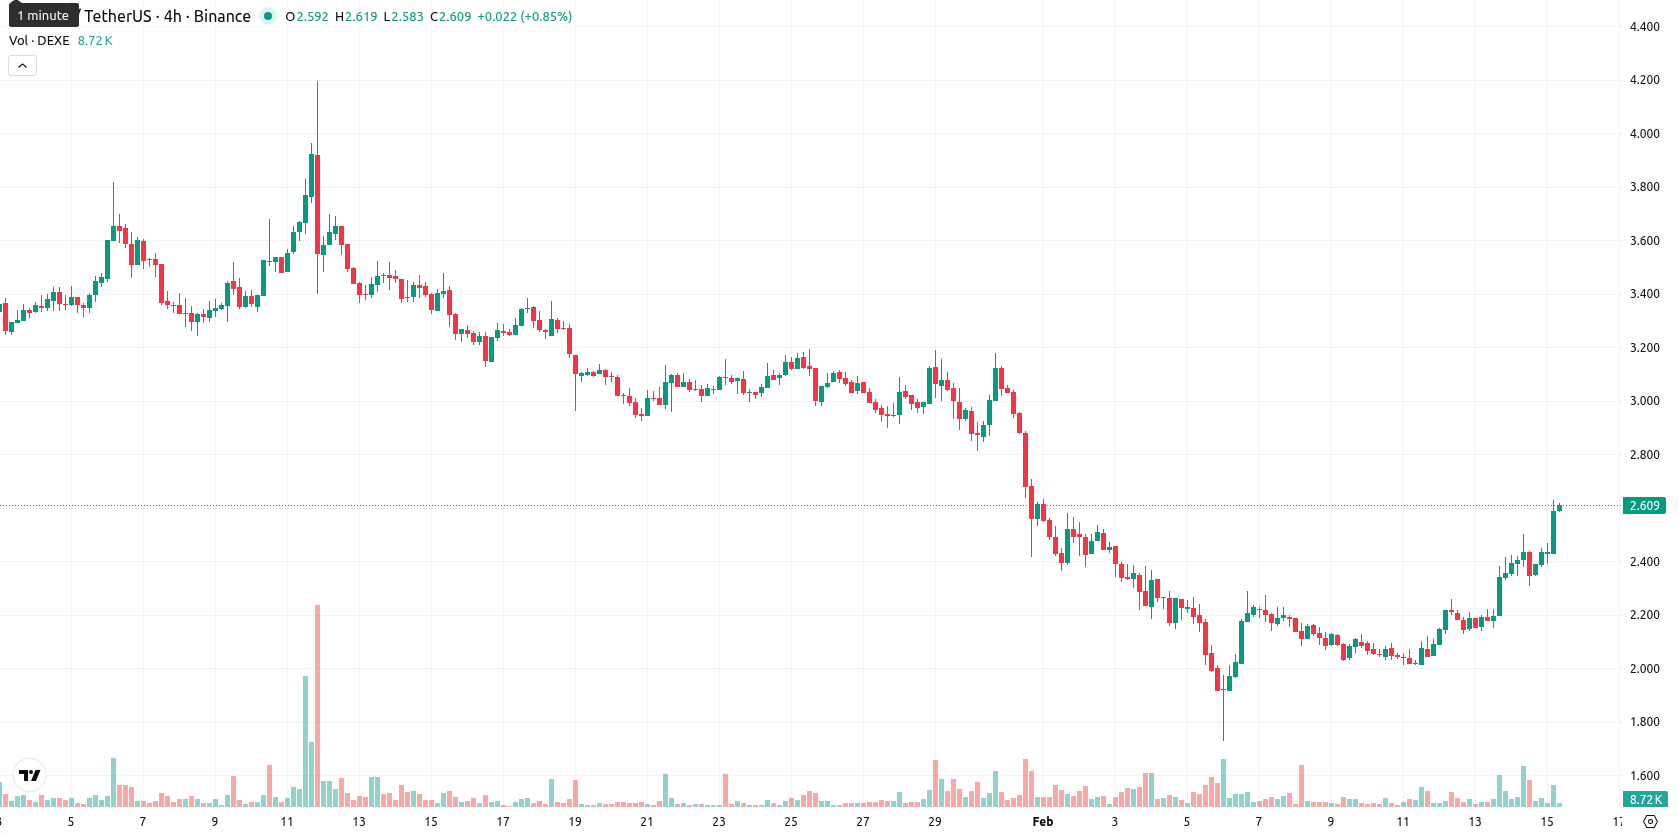
Sideways consolidation favored as volatility stays contained
Over the next five sessions, typical volatility is expected between $2.35 and $2.80, with a low probability for further price increases (below 20%). The base case is for DEXE to consolidate within a sideways range between $2.35 and $2.80. A break above $2.80 could push a move toward $2.93, while falling below $2.46 may open the door to $2.35, as most weekly and long-term signals remain bearish.
Anton Kharitonov, expert at Traders Union, sees the current DEXE setup as technically conflicted in the short term and largely bearish in the bigger picture. He believes mixed momentum signals and a lack of supporting news provide little basis for upside conviction. Base case points to sideways action between $2.35 and $2.80 unless $2.80 is reclaimed. "Until DEXE breaks above $2.80 decisively, I remain cautious and expect limited upside."
Previously it was reported that DeXe is trading below major moving averages with dominant bearish momentum, as highlighted by a bearish MACD and a mildly negative RSI, while the ADX suggests only moderate trend strength. Despite a recent price bounce and intraday volatility, strong overhead resistance persists near $2.46–$2.47, and the short-term outlook remains lower with a bias toward consolidation unless a breakout above established resistance occurs.
Source of Data:
DEXE Price Analysis by TU
The analysis is based on a proprietary model combining technical, on-chain, and expert data. Not investment advice. See
methodology
The information is based on forecasts and does not constitute investment advice or a guarantee of future results. Market conditions may change. See our Disclaimer and Editorial Integrity for details.
Subscribe to TU news


Did you like the article?





Top News


Top 5 companies for you

United States
-
 Afghanistan
-
 Albania
-
 Algeria
-
 Angola
-
 Argentina
-
 Armenia
-
 Australia
-
 Austria
-
 Azerbaijan
-
 Bahamas
-
 Bahrain
-
 Bangladesh
-
 Belarus
-
 Belgium
-
 Bolivia
-
 Botswana
-
 Brazil
-
 Brunei
-
 Bulgaria
-
 Cambodia
-
 Cameroon
-
 Canada
-
 Chile
Chile
-
 China
China
-
 Colombia
-
 Congo
Congo
-
 Costa Rica
-
 Cote d'Ivoire
-
 Croatia
-
 Cuba
Cuba
-
 Cyprus
-
 Czechia
-
 DR Congo
-
 Denmark
-
 Dominican Republic
-
 Ecuador
-
 Egypt
Egypt
-
 El Salvador
-
 Estonia
-
 Eswatini
-
 Ethiopia
-
 Finland
-
 France
-
 Georgia
-
 Germany
-
 Ghana
Ghana
-
 Greece
-
 Haiti
Haiti
-
 Hong Kong
-
 Hungary
-
 India
India
-
 Indonesia
-
 Iran, Islamic republic
-
 Iraq
Iraq
-
 Ireland
-
 Israel
-
 Italy
Italy
-
 Jamaica
-
 Japan
Japan
-
 Jordan
-
 Kazakhstan
-
 Kenya
Kenya
-
 Korea
Korea
-
 Kuwait
-
 Kyrgyzstan
-
 Laos
Laos
-
 Latvia
-
 Lebanon
-
 Lesotho
-
 Libya
Libya
-
 Lithuania
-
 Luxembourg
-
 Madagascar
-
 Malaysia
-
 Malta
Malta
-
 Mauritius
-
 Mexico
-
 Moldova
-
 Mongolia
-
 Montenegro
-
 Morocco
-
 Mozambique
-
 Myanmar
-
 Namibia
-
 Nepal
Nepal
-
 Netherlands
-
 New Zealand
-
 Nigeria
-
 North Macedonia
-
 Norway
-
 Oman
Oman
-
 Pakistan
-
 Palestine
-
 Panama
-
 Papua New Guinea
-
 Paraguay
-
 Peru
Peru
-
 Philippines
-
 Poland
-
 Portugal
-
 Puerto Rico
-
 Qatar
Qatar
-
 Reunion
-
 Romania
-
 Rwanda
-
 Saudi Arabia
-
 Serbia
-
 Singapore
-
 Slovakia
-
 Slovenia
-
 Somalia
-
 South Africa
-
 Spain
Spain
-
 Sri Lanka
-
 Sweden
-
 Switzerland
-
 Syria
Syria
-
 Taiwan
-
 Tajikistan
-
 Tanzania
-
 Thailand
-
 Trinidad and Tobago
-
 Tunisia
-
 Turkey
-
 UAE
UAE
-
 Uganda
-
 Ukraine
-
 United Kingdom
-
United States
-
 Uruguay
-
 Uzbekistan
-
 Venezuela
-
 Vietnam
-
 Yemen
Yemen
-
 Zambia
-
 Zimbabwe
- Forex
- Crypto










Live News


