

+9.42% for DeXe — price surges toward resistance despite caution signals

DeXe (DEXE) is trading at $2.42, which is below the MA-20 ($2.47), MA-50 ($2.94), and MA-200 ($5.76), indicating dominant downward pressure in both medium and long-term trends despite a very recent bounce. The Ichimoku Kijun at $2.46 acts as immediate dynamic resistance, while the MA-20 near $2.47 also reinforces overhead resistance for short-term outlook.
DEXE price prediction
Current price:
$1.39
-0.03
2.32%
Real-time Data
15:40
Daily range
1.35
 1.4
1.4
Weekly range
1.36
1.64
1.64
Loading...
Highlights
- DEXE trades at $2.42, below key moving averages (MA-20 at $2.47, MA-50 at $2.94, MA-200 at $5.76), confirming persistent medium- and long-term downward pressure.
- Momentum indicators are mixed: the daily MACD shows strong bearishness, RSI is mildly bearish at 42.93, and the Stochastic RSI is overbought at 100, suggesting a possible short-term pullback.
- Expect DEXE to consolidate between $2.20 and $2.55 over the next five days, with sub-$2.20 weakness exposing further downside, and resistance concentrated at $2.47–$2.55.
Bearish momentum diverges from overbought signals amid intraday volatility
Momentum indicators are mixed: the daily MACD signals strong bearish momentum, while the ADX on D1 and W1 shows only moderate trend strength. RSI on D1 reads 42.93 (mild bearish), and Stochastic RSI is deeply overbought at 100, pointing to a potential short-term pullback. The Bull/Bear Power value is slightly positive at 0.12, meaning buyers have recently gained some traction intraday. There was a gap up between the previous close ($2.21) and today’s open ($2.36), with the price currently trading at the top end of today’s range ($2.42 out of $2.34 – $2.42), signaling high volatility and clear strength toward session highs. However, the combination of overbought oscillators and continued negative medium-term momentum reflects a notable divergence.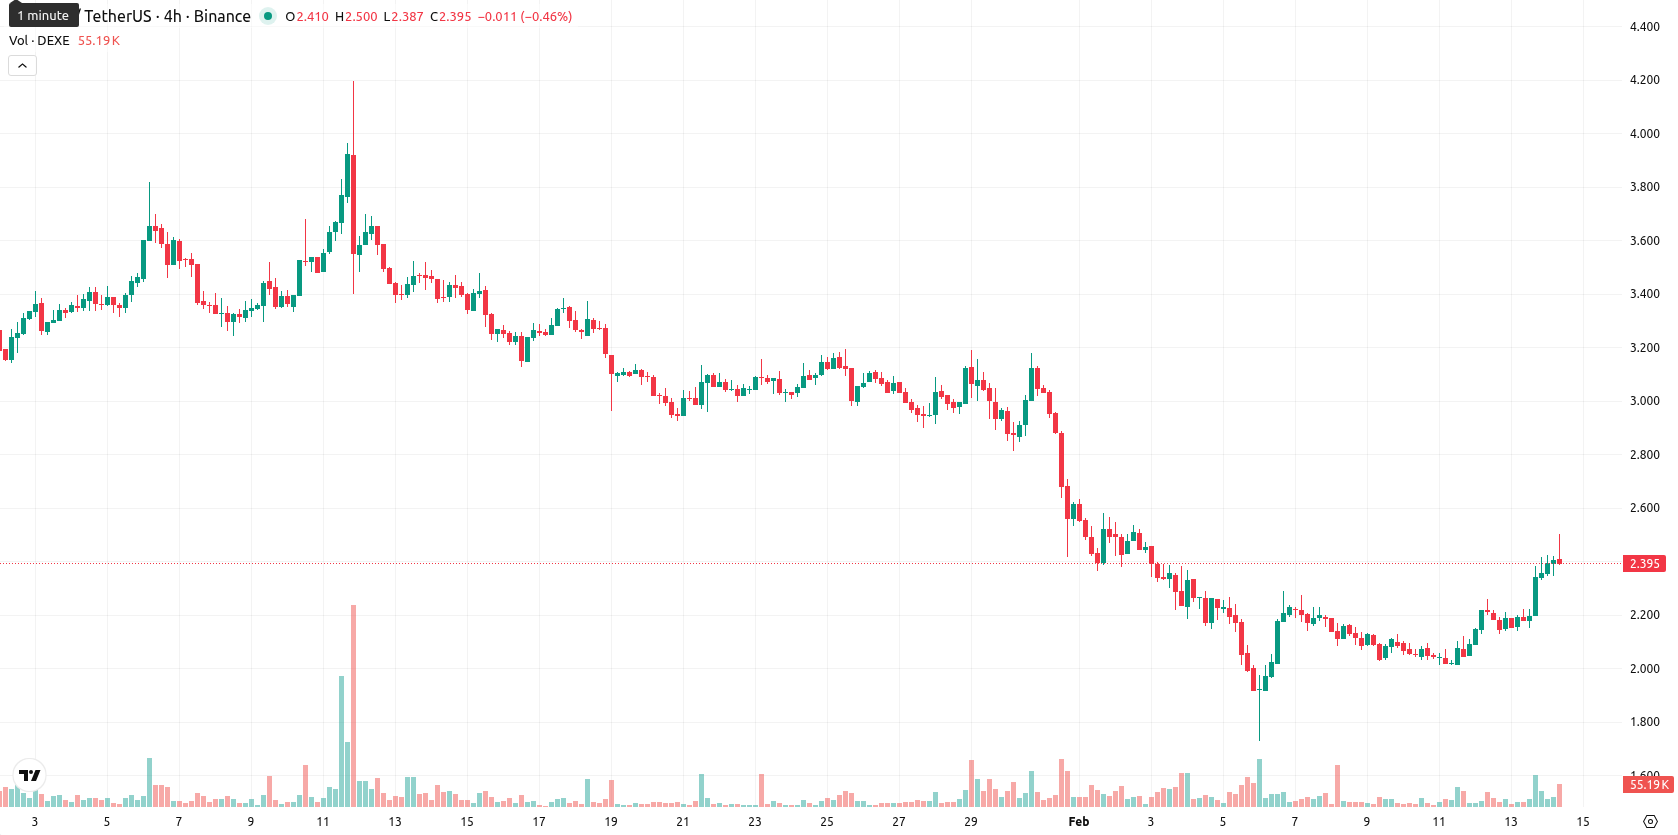
Lower price bias dominates as volatility narrows short-term range
For the next five trading days, we expect DEXE to trade in a normalized corridor between $2.20 and $2.55, capturing current volatility. Given all W1 indicators (MACD, RSI, ADX, MA-50) remain bearish, there is a very low probability (less than 20%) of a sustained price increase, making further declines more likely. In the baseline scenario, price action may consolidate sideways between $2.20 and $2.55. In a bullish scenario, a clear breakout above the $2.47 – $2.55 resistance zone could open the way for a short-term rally. In a bearish scenario, a drop below $2.20 would expose the asset to renewed selling pressure and challenge toward lower supports.
Viktoras Karapetjanc, analyst at Traders Union, sees DEXE price action under persistent medium- and long-term pressure, but notes buyers are starting to show interest in the short term. He believes the $2.20 to $2.55 range will likely contain volatility, with only a clear break above resistance reviving a more bullish case. Macro sentiment remains cautious given broader trend weakness, though the recent bounce and intraday gap up signal pockets of optimism. Karapetjanc stresses that tactical patience is still key while waiting for confirmation of a real shift. "If DEXE manages to hold above $2.47 and break $2.55, the odds for a short-term rally would meaningfully improve."
Previously it was reported that DeXe (DEXE) trades below key moving averages, with bearish momentum indicated by the MACD and a weak trend signal from the ADX, while RSI and CCI reflect neither oversold nor strongly bullish conditions. Despite this, a volatile gap-driven gain and elevated Stochastic RSI suggest short-term overbought conditions, with nearby resistance around $2.46 and support just above recent short-term lows.
Source of Data:
DEXE Price Analysis by TU
The analysis is based on a proprietary model combining technical, on-chain, and expert data. Not investment advice. See
methodology
The information is based on forecasts and does not constitute investment advice or a guarantee of future results. Market conditions may change. See our Disclaimer and Editorial Integrity for details.
Subscribe to TU news


Did you like the article?






Top News


Top 5 companies for you

United States
-
 Afghanistan
-
 Albania
-
 Algeria
-
 Angola
-
 Argentina
-
 Armenia
-
 Australia
-
 Austria
-
 Azerbaijan
-
 Bahamas
-
 Bahrain
-
 Bangladesh
-
 Belarus
-
 Belgium
-
 Bolivia
-
 Botswana
-
 Brazil
-
 Brunei
-
 Bulgaria
-
 Cambodia
-
 Cameroon
-
 Canada
-
 Chile
-
 China
-
 Colombia
-
 Congo
-
 Costa Rica
-
 Cote d'Ivoire
-
 Croatia
-
 Cuba
-
 Cyprus
-
 Czechia
-
 DR Congo
-
 Denmark
-
 Dominican Republic
-
 Ecuador
-
 Egypt
-
 El Salvador
-
 Estonia
-
 Eswatini
-
 Ethiopia
-
 Finland
-
 France
-
 Georgia
-
 Germany
-
 Ghana
-
 Greece
-
 Haiti
-
 Hong Kong
-
 Hungary
-
 India
-
 Indonesia
-
 Iran, Islamic republic
-
 Iraq
-
 Ireland
-
 Israel
-
 Italy
-
 Jamaica
-
 Japan
-
 Jordan
-
 Kazakhstan
-
 Kenya
-
 Korea
-
 Kuwait
-
 Kyrgyzstan
-
 Laos
-
 Latvia
-
 Lebanon
-
 Lesotho
-
 Libya
-
 Lithuania
-
 Luxembourg
-
 Madagascar
-
 Malaysia
-
 Malta
-
 Mauritius
-
 Mexico
-
 Moldova
-
 Mongolia
-
 Montenegro
-
 Morocco
-
 Mozambique
-
 Myanmar
-
 Namibia
-
 Nepal
-
 Netherlands
-
 New Zealand
-
 Nigeria
-
 North Macedonia
-
 Norway
-
 Oman
-
 Pakistan
-
 Palestine
-
 Panama
-
 Papua New Guinea
-
 Paraguay
-
 Peru
-
 Philippines
-
 Poland
-
 Portugal
-
 Puerto Rico
-
 Qatar
-
 Reunion
-
 Romania
-
 Rwanda
-
 Saudi Arabia
-
 Serbia
-
 Singapore
-
 Slovakia
-
 Slovenia
-
 Somalia
-
 South Africa
-
 Spain
-
 Sri Lanka
-
 Sweden
-
 Switzerland
-
 Syria
-
 Taiwan
-
 Tajikistan
-
 Tanzania
-
 Thailand
-
 Trinidad and Tobago
-
 Tunisia
-
 Turkey
-
 UAE
-
 Uganda
-
 Ukraine
-
 United Kingdom
-
United States
-
 Uruguay
-
 Uzbekistan
-
 Venezuela
-
 Vietnam
-
 Yemen
-
 Zambia
-
 Zimbabwe
- Forex
- Crypto










Live News


