

DeXe price prediction: Will technical weakness push DEXE lower?

DeXe (DEXE) is trading at $2.32, slightly below its MA-20 at $2.34 and notably under both the MA-50 at $2.89 and MA-200 at $5.66. This places the token in a short-term neutral to bearish position, with its price remaining under key moving averages, signaling ongoing pressure from sellers and a persistent negative long-term trend.
DEXE price prediction
Current price:
$1.87
0.04
2.08%
Real-time Data
00:36
Daily range
1.79
 1.89
1.89
1.89
Weekly range
1.72
1.92
1.92
Loading...
Highlights
- DEXE is trading at $2.32, below MA-20 ($2.34), MA-50 ($2.89), and MA-200 ($5.66), indicating persistent bearish momentum across all timeframes.
- MACD shows a strong sell bias, ADX suggests a weak trend, and RSI leans bearish at 45.75, reinforcing the overall negative price outlook.
- Key technical range for the next five days is $2.05–$2.45, with less than 20% probability of a price increase and further declines likely if $2.05 support breaks.
Mixed technicals as momentum weakens and overbought signals emerge
Momentum indicators are weak for DEXE, as the MACD maintains a strong sell bias and the ADX suggests a lack of distinct trend strength. The RSI reads 45.75, pointing bearish, while a very high Stochastic RSI value of 98.08 signals the token is overbought in the short run. The Commodity Channel Index is neutral, the Awesome Oscillator does not confirm a clear trend, and Bull/Bear Power is slightly positive at 0.19, showing some buyer presence, though this is in contrast to broader bearish momentum. The closest dynamic support sits at the Ichimoku Kijun of $2.46, with resistance around the MA-50 at $2.89.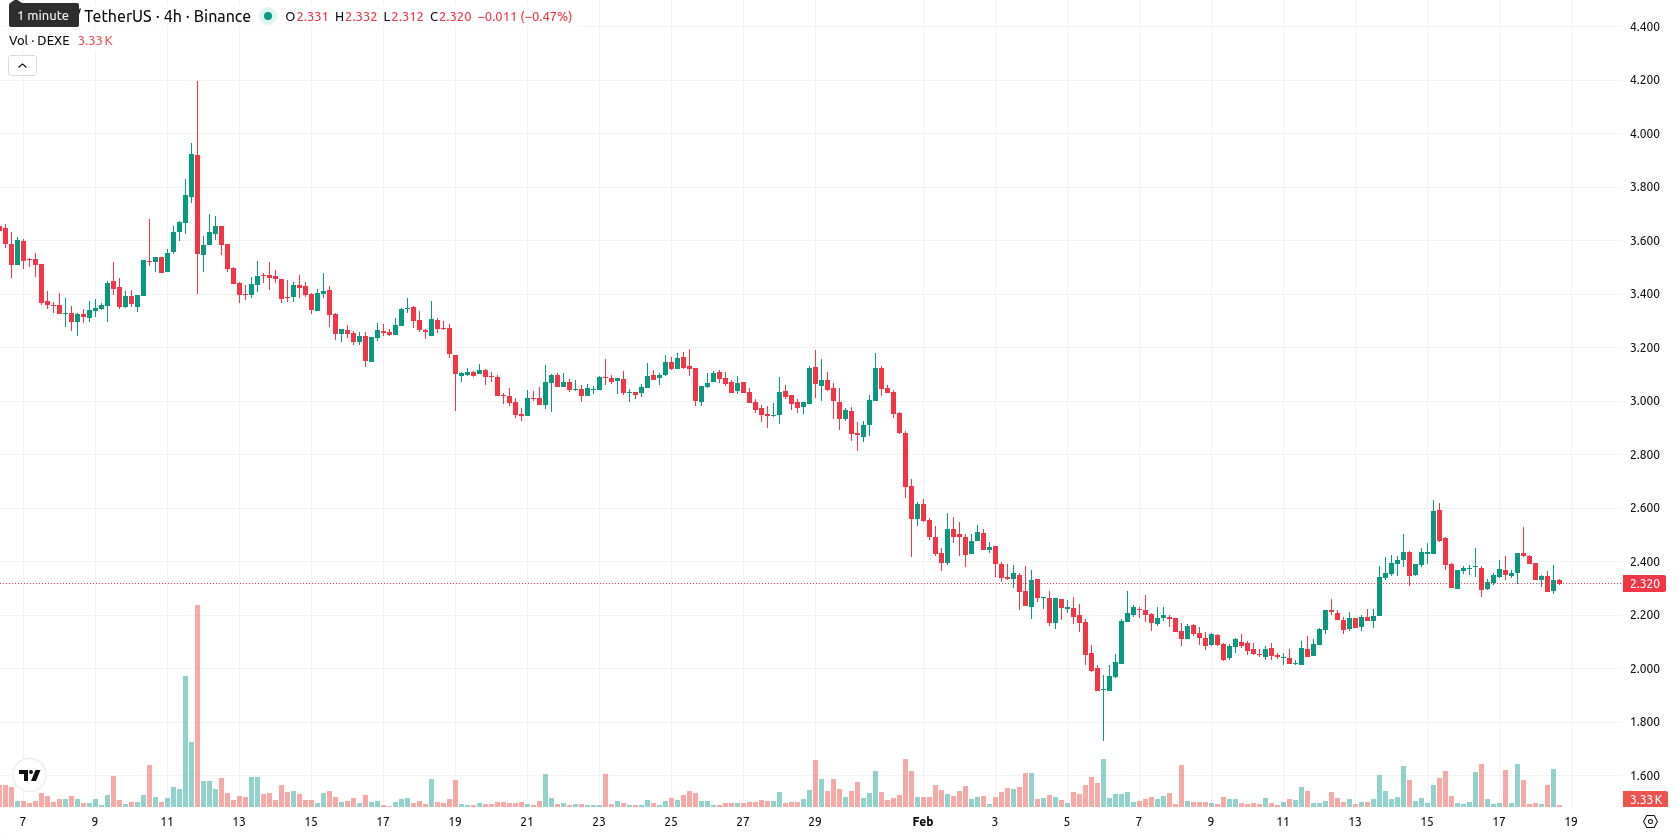
Sideways to downward bias expected amid muted reversal signals
Looking ahead, DEXE is likely to remain within a volatility band between $2.05 and $2.45 over the next five trading days. Probabilities favor a continuation of the sideways to downward trend, as technicals do not suggest any meaningful short-term bullish reversal. Should the price recover above $2.46, a move toward the $2.45–$2.89 area is possible on renewed buying. Conversely, a drop below $2.05 would signal the potential for additional declines, bringing lower support levels into focus if sellers remain dominant.
Anton Kharitonov, analyst at Traders Union, sees DeXe (DEXE) trading in a clear technical downtrend with weak momentum indicators and the price holding below all major moving averages. He notes there is little in the way of positive price signals, and short-term overbought signals could add further pressure if sellers regain control. Without fresh news to shift market sentiment, Kharitonov is defensive in his outlook. "Unless DEXE sustains a recovery above $2.46, I remain cautious and prefer to wait for clearer bullish confirmation before considering any long exposure."
Last time, analysts noted that DeXe is exhibiting short-term support above its 20-day moving average, but remains under sustained medium- and long-term selling pressure as it trades well below its 50- and 200-day moving averages. Despite bullish intraday momentum, momentum indicators such as MACD and ADX remain weak, while oscillators signal overbought conditions and resistance is expected near $2.90 with downside risk heightened by fragile support levels.
Source of Data:
DEXE Price Analysis by TU
The analysis is based on a proprietary model combining technical, on-chain, and expert data. Not investment advice. See
methodology
The information is based on forecasts and does not constitute investment advice or a guarantee of future results. Market conditions may change. See our Disclaimer and Editorial Integrity for details.
Subscribe to TU news


Did you like the article?





Top News


Top 5 companies for you

United States
-
 Afghanistan
-
 Albania
-
 Algeria
-
 Angola
-
 Argentina
-
 Armenia
-
 Australia
-
 Austria
-
 Azerbaijan
-
 Bahamas
-
 Bahrain
-
 Bangladesh
-
 Belarus
-
 Belgium
-
 Bolivia
-
 Botswana
-
 Brazil
-
 Brunei
-
 Bulgaria
-
 Cambodia
-
 Cameroon
-
 Canada
-
 Chile
Chile
-
 China
China
-
 Colombia
-
 Congo
Congo
-
 Costa Rica
-
 Cote d'Ivoire
-
 Croatia
-
 Cuba
Cuba
-
 Cyprus
-
 Czechia
-
 DR Congo
-
 Denmark
-
 Dominican Republic
-
 Ecuador
-
 Egypt
Egypt
-
 El Salvador
-
 Estonia
-
 Eswatini
-
 Ethiopia
-
 Finland
-
 France
-
 Georgia
-
 Germany
-
 Ghana
Ghana
-
 Greece
-
 Haiti
Haiti
-
 Hong Kong
-
 Hungary
-
 India
India
-
 Indonesia
-
 Iran, Islamic republic
-
 Iraq
Iraq
-
 Ireland
-
 Israel
-
 Italy
Italy
-
 Jamaica
-
 Japan
Japan
-
 Jordan
-
 Kazakhstan
-
 Kenya
Kenya
-
 Korea
Korea
-
 Kuwait
-
 Kyrgyzstan
-
 Laos
Laos
-
 Latvia
-
 Lebanon
-
 Lesotho
-
 Libya
Libya
-
 Lithuania
-
 Luxembourg
-
 Madagascar
-
 Malaysia
-
 Malta
Malta
-
 Mauritius
-
 Mexico
-
 Moldova
-
 Mongolia
-
 Montenegro
-
 Morocco
-
 Mozambique
-
 Myanmar
-
 Namibia
-
 Nepal
Nepal
-
 Netherlands
-
 New Zealand
-
 Nigeria
-
 North Macedonia
-
 Norway
-
 Oman
Oman
-
 Pakistan
-
 Palestine
-
 Panama
-
 Papua New Guinea
-
 Paraguay
-
 Peru
Peru
-
 Philippines
-
 Poland
-
 Portugal
-
 Puerto Rico
-
 Qatar
Qatar
-
 Reunion
-
 Romania
-
 Rwanda
-
 Saudi Arabia
-
 Serbia
-
 Singapore
-
 Slovakia
-
 Slovenia
-
 Somalia
-
 South Africa
-
 Spain
Spain
-
 Sri Lanka
-
 Sweden
-
 Switzerland
-
 Syria
Syria
-
 Taiwan
-
 Tajikistan
-
 Tanzania
-
 Thailand
-
 Trinidad and Tobago
-
 Tunisia
-
 Turkey
-
 UAE
UAE
-
 Uganda
-
 Ukraine
-
 United Kingdom
-
United States
-
 Uruguay
-
 Uzbekistan
-
 Venezuela
-
 Vietnam
-
 Yemen
Yemen
-
 Zambia
-
 Zimbabwe
- Forex
- Crypto










Live News


