
Bitcoin Cash declines amid mixed weekly indicators and prepares for likely consolidation between $490 and $585 – weekly analysis

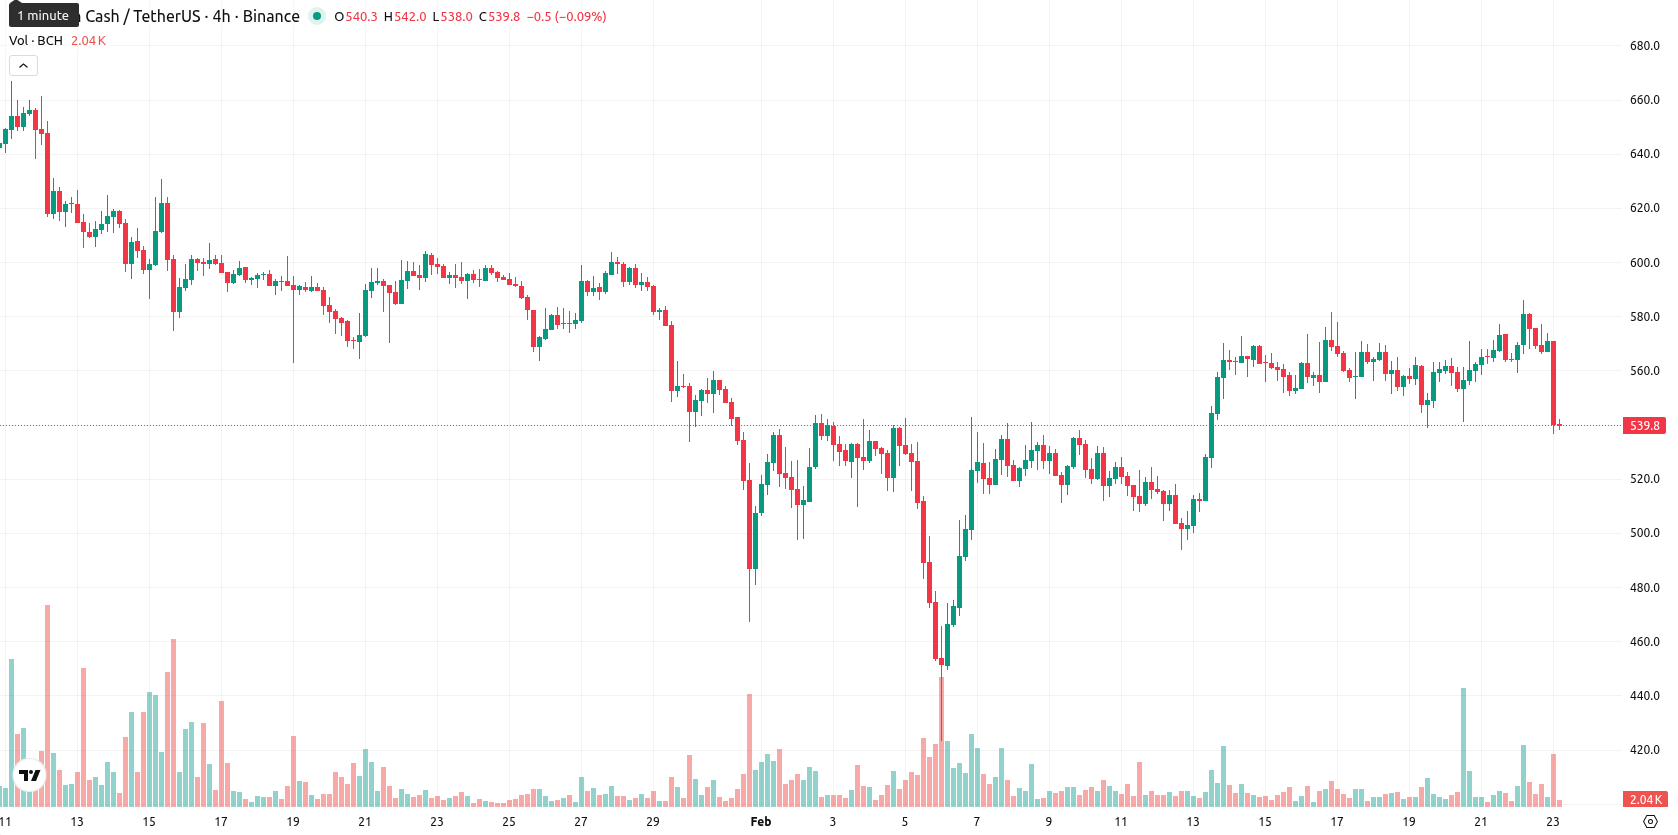
Bitcoin Cash (BCH) finished the week trading just above the MA-20 at $539.67, after slipping 4.90% from the prior session. Over the past seven days, BCH has struggled to gain traction, closing below both the MA-50 ($573.20) and MA-200 ($561.64), which highlights ongoing medium- and long-term resistance from sellers.
Highlights
- Bitcoin Cash is trading at $540, just above the MA-20 ($539.67), but below the MA-50 ($573.20) and MA-200 ($561.64), indicating persistent medium- and long-term resistance.
- Daily momentum signals are mixed, with the MACD neutral, ADX at 'Sell,' and short-term oscillators diverging, underlining weak bullish conviction and increased selling pressure.
- Expected 5-day trading range is $490–$585, with over 80% probability of a price increase; key support sits at $512.50 and main resistance at $573.20.
Layla upgrade and payment adoption poised to shape BCH sentiment this week
A major upcoming event for Bitcoin Cash is the planned 'Layla' network upgrade scheduled for May 2026, which is anticipated to influence sentiment depending on payment adoption trends and market conditions. Secondary factors include the current market capitalization standing at around $11.4 billion and ongoing monitoring of activities by large holders. No major regulatory or corporate actions impacting BCH have been confirmed recently.
Momentum weakens over the week as technical resistance limits further upside
On the weekly timeframe, BCH maintains short-term stability just above the MA-20 ($539.67) while facing notable resistance at the MA-50 ($573.20) and MA-200 ($561.64). Support is reinforced by the Ichimoku Kijun at $512.50, and upside potential remains capped at the MA-50, marking $573 as the principal resistance. Weekly indicators are mixed: the RSI (W1) holds at 54.71, signifying moderate buying, but the Stochastic RSI indicates overbought conditions and the Commodity Channel Index appears ready to cool, with momentum signals demonstrating weak bullish conviction and increased downside pressure.
Consolidation expected this week amid high volatility and limited downside risk
For the coming week, BCH is likely to consolidate between support at $512 and resistance at $573, with the trading range projected between $490 and $585, reflecting recent high volatility. The probability of a price increase is estimated above 80%, suggesting that a breakdown below $512 is less likely under current conditions. A bullish scenario would see BCH surpass $573 and target $585, while a bearish case could see a retest of the $490 – $512 support zone if sellers regain control.
Previously it was reported that Bitcoin Cash is maintaining a neutral to slightly bullish posture, trading above its short-term moving average but encountering resistance near its longer-term moving averages. Mixed technical signals, including neutral-bullish oscillators and ongoing seller pressure, suggest ongoing consolidation within a defined range, with key support near $513.50 and resistance around $579.75.


Latest Bitcoin Cash News


-
 Afghanistan
-
 Albania
-
 Algeria
-
 Angola
-
 Argentina
-
 Armenia
-
 Australia
-
 Austria
-
 Azerbaijan
-
 Bahamas
-
 Bahrain
-
 Bangladesh
-
 Belarus
-
 Belgium
-
 Bolivia
-
 Botswana
-
 Brazil
-
 Brunei
-
 Bulgaria
-
 Cambodia
-
 Cameroon
-
 Canada
-
 Chile
Chile
-
 China
China
-
 Colombia
-
 Congo
Congo
-
 Costa Rica
-
 Cote d'Ivoire
-
 Croatia
-
 Cuba
Cuba
-
 Cyprus
-
 Czechia
-
 DR Congo
-
 Denmark
-
 Dominican Republic
-
 Ecuador
-
 Egypt
Egypt
-
 El Salvador
-
 Estonia
-
 Eswatini
-
 Ethiopia
-
 Finland
-
 France
-
 Georgia
-
 Germany
-
 Ghana
Ghana
-
 Greece
-
 Haiti
Haiti
-
 Hong Kong
-
 Hungary
-
 India
India
-
 Indonesia
-
 Iran, Islamic republic
-
 Iraq
Iraq
-
 Ireland
-
 Israel
-
 Italy
Italy
-
 Jamaica
-
 Japan
Japan
-
 Jordan
-
 Kazakhstan
-
 Kenya
Kenya
-
 Korea
Korea
-
 Kuwait
-
 Kyrgyzstan
-
 Laos
Laos
-
 Latvia
-
 Lebanon
-
 Lesotho
-
 Libya
Libya
-
 Lithuania
-
 Luxembourg
-
 Madagascar
-
 Malaysia
-
 Malta
Malta
-
 Mauritius
-
 Mexico
-
 Moldova
-
 Mongolia
-
 Montenegro
-
 Morocco
-
 Mozambique
-
 Myanmar
-
 Namibia
-
 Nepal
Nepal
-
 Netherlands
-
 New Zealand
-
 Nigeria
-
 North Macedonia
-
 Norway
-
 Oman
Oman
-
 Pakistan
-
 Palestine
-
 Panama
-
 Papua New Guinea
-
 Paraguay
-
 Peru
Peru
-
 Philippines
-
 Poland
-
 Portugal
-
 Puerto Rico
-
 Qatar
Qatar
-
 Reunion
-
 Romania
-
 Rwanda
-
 Saudi Arabia
-
 Serbia
-
 Singapore
-
 Slovakia
-
 Slovenia
-
 Somalia
-
 South Africa
-
 Spain
Spain
-
 Sri Lanka
-
 Sweden
-
 Switzerland
-
 Syria
Syria
-
 Taiwan
-
 Tajikistan
-
 Tanzania
-
 Thailand
-
 Trinidad and Tobago
-
 Tunisia
-
 Turkey
-
 UAE
UAE
-
 Uganda
-
 Ukraine
-
 United Kingdom
-
United States
-
 Uruguay
-
 Uzbekistan
-
 Venezuela
-
 Vietnam
-
 Yemen
Yemen
-
 Zambia
-
 Zimbabwe
- Forex
- Crypto
