
BCH maintains a neutral-to-bullish stance as consolidation continues in the $513.50–$561 range on the charts – weekly report

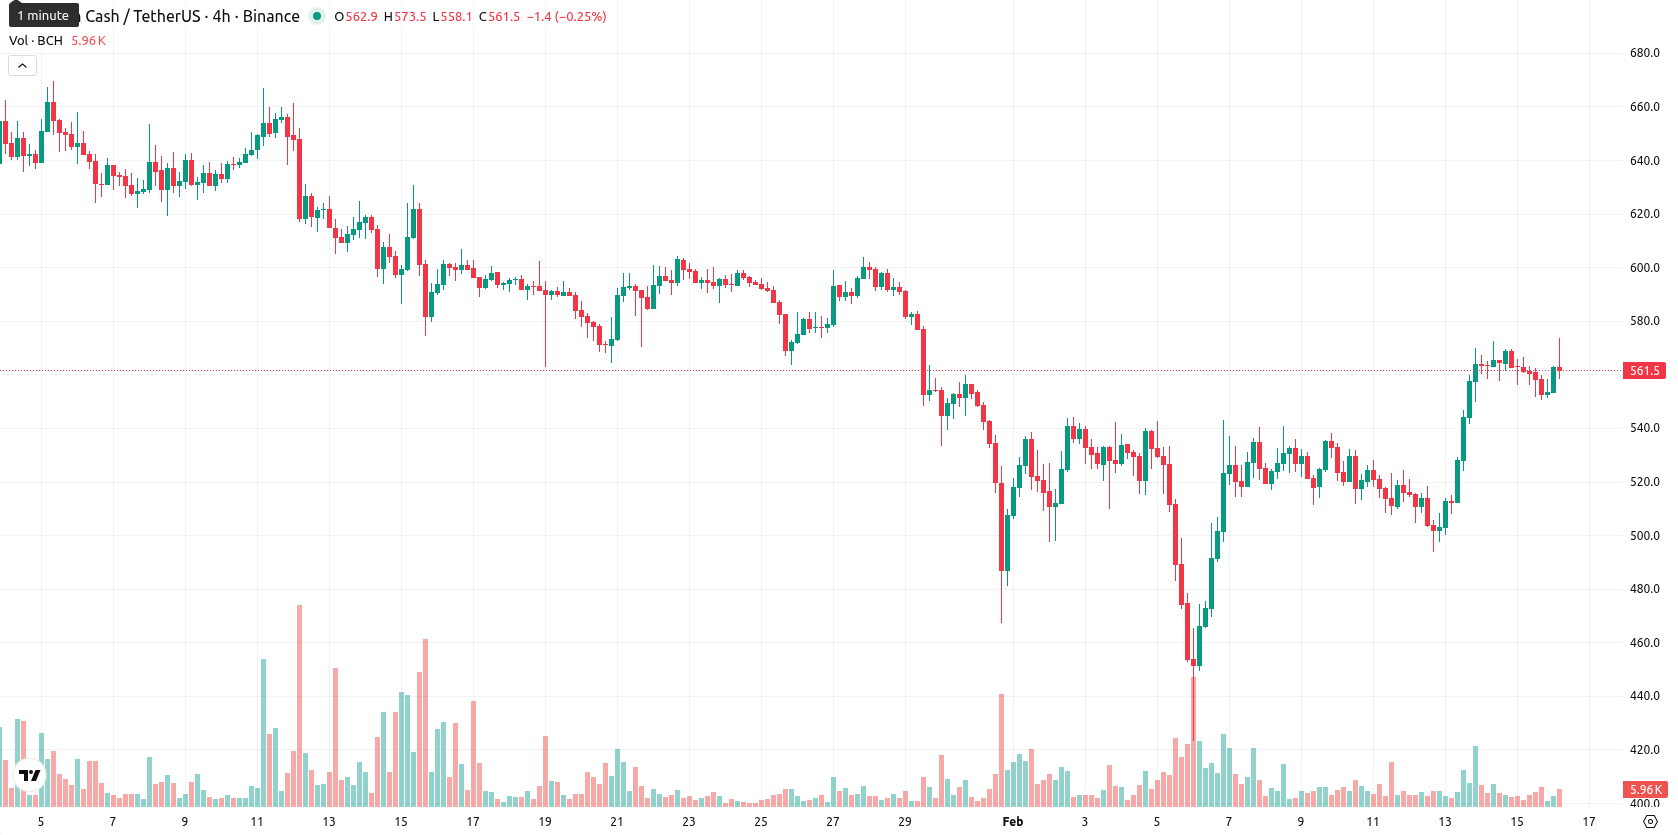
Bitcoin Cash (BCH) is trading at $559.70 after a week of modest movement. Over the past seven days, BCH has held above the MA-20 ($535.41), but remains below the MA-50 ($579.75) and MA-200 ($561.20), signaling a short-term bullish stance but with the price facing longer-term resistance near major moving averages.
Highlights
- Bitcoin Cash is trading at $559.70, above the MA-20 ($535.41) and below MA-50 ($579.75) and MA-200 ($561.20), reflecting a short-term bullish bias amid longer-term resistance.
- Momentum signals are mixed: daily MACD shows a strong sell, ADX signals persistent seller pressure, while RSI and CCI remain in neutral-buy territory with overbought intraday conditions.
- BCH is expected to consolidate between dynamic support at $513.50 and resistance at $561.00, with an 80%+ probability of trading within the $510.00–$555.40 range next week.
Mixed momentum signals as price tests key moving averages this week
Weekly technical analysis shows Bitcoin Cash maintaining a neutral to slightly bullish posture. The price sits above the short-term MA-20, but has not overcome the heavier resistance at the MA-50 or MA-200. Key levels include dynamic support at the Ichimoku Kijun near $513.50 and resistance at the MA-50 ($579.75). Weekly indicators reflect indecision: momentum is mixed, with MACD and ADX showing ongoing seller pressure, while the RSI and Commodity Channel Index remain neutral-bullish. Stochastic RSI indicates heavy overbought conditions, while Bull/Bear Power suggests buyers dominate despite stretched intraday momentum.
Bullish breakout risk as consolidation dominates next week’s outlook
In the coming week, BCH is likely to consolidate between $513.50 and $561.00, with an anticipated trading range of $510.00 to $555.40. The probability of an upward price movement exceeds 80%, so a decline is less likely at this stage. A bullish breakout above $561.00 — $579.75 would set the stage for renewed upward momentum, while a drop below $513.50 may trigger deeper short-term corrections. Short-term consolidation remains the baseline scenario unless either support or resistance is broken.
Previously it was reported that Bitcoin Cash is trading above its short- and long-term moving averages, reflecting bullish momentum, yet remains below key resistance at the 50-day moving average. Mixed technical signals—neutral RSI, overbought intraday oscillators, and strong selling pressure on the MACD—suggest near-term consolidation with dynamic support near the Ichimoku Kijun and heightened market interest following index outperformance.


Latest Bitcoin Cash News


-
 Afghanistan
-
 Albania
-
 Algeria
-
 Angola
-
 Argentina
-
 Armenia
-
 Australia
-
 Austria
-
 Azerbaijan
-
 Bahamas
-
 Bahrain
-
 Bangladesh
-
 Belarus
-
 Belgium
-
 Bolivia
-
 Botswana
-
 Brazil
-
 Brunei
-
 Bulgaria
-
 Cambodia
-
 Cameroon
-
 Canada
-
 Chile
Chile
-
 China
China
-
 Colombia
-
 Congo
Congo
-
 Costa Rica
-
 Cote d'Ivoire
-
 Croatia
-
 Cuba
Cuba
-
 Cyprus
-
 Czechia
-
 DR Congo
-
 Denmark
-
 Dominican Republic
-
 Ecuador
-
 Egypt
Egypt
-
 El Salvador
-
 Estonia
-
 Eswatini
-
 Ethiopia
-
 Finland
-
 France
-
 Georgia
-
 Germany
-
 Ghana
Ghana
-
 Greece
-
 Haiti
Haiti
-
 Hong Kong
-
 Hungary
-
 India
India
-
 Indonesia
-
 Iran, Islamic republic
-
 Iraq
Iraq
-
 Ireland
-
 Israel
-
 Italy
Italy
-
 Jamaica
-
 Japan
Japan
-
 Jordan
-
 Kazakhstan
-
 Kenya
Kenya
-
 Korea
Korea
-
 Kuwait
-
 Kyrgyzstan
-
 Laos
Laos
-
 Latvia
-
 Lebanon
-
 Lesotho
-
 Libya
Libya
-
 Lithuania
-
 Luxembourg
-
 Madagascar
-
 Malaysia
-
 Malta
Malta
-
 Mauritius
-
 Mexico
-
 Moldova
-
 Mongolia
-
 Montenegro
-
 Morocco
-
 Mozambique
-
 Myanmar
-
 Namibia
-
 Nepal
Nepal
-
 Netherlands
-
 New Zealand
-
 Nigeria
-
 North Macedonia
-
 Norway
-
 Oman
Oman
-
 Pakistan
-
 Palestine
-
 Panama
-
 Papua New Guinea
-
 Paraguay
-
 Peru
Peru
-
 Philippines
-
 Poland
-
 Portugal
-
 Puerto Rico
-
 Qatar
Qatar
-
 Reunion
-
 Romania
-
 Rwanda
-
 Saudi Arabia
-
 Serbia
-
 Singapore
-
 Slovakia
-
 Slovenia
-
 Somalia
-
 South Africa
-
 Spain
Spain
-
 Sri Lanka
-
 Sweden
-
 Switzerland
-
 Syria
Syria
-
 Taiwan
-
 Tajikistan
-
 Tanzania
-
 Thailand
-
 Trinidad and Tobago
-
 Tunisia
-
 Turkey
-
 UAE
UAE
-
 Uganda
-
 Ukraine
-
 United Kingdom
-
United States
-
 Uruguay
-
 Uzbekistan
-
 Venezuela
-
 Vietnam
-
 Yemen
Yemen
-
 Zambia
-
 Zimbabwe
- Forex
- Crypto
