

RNDR slips further and remains under pressure with RSI at 42.56 and MACD signaling weakness – weekly forecast

Render (RNDR) trades at $1.339, marking a weekly drop that keeps it below the MA-20 at $1.3985, MA-50 at $1.7831, and MA-200 at $2,4408. The asset remains under pressure on the W1 timeframe, trading beneath all major weekly moving averages.
RENDER price prediction
Current price:
$1.258
-0.072
5.41%
Real-time Data
12:58
Daily range
1.19
 1.286
1.286
Weekly range
1.2310
1.4960
1.4960
Loading...
Highlights
- RNDR trades at $1.339, below its MA-20 ($1.3985), MA-50 ($1.7831), and MA-200 ($2.4408), confirming persistent bearish pressure across all timeframes.
- Momentum indicators reinforce bearish sentiment, with daily MACD and ADX negative, RSI at 42.56, and intraday sellers dominating as shown by Bull/Bear Power and the Awesome Oscillator.
- Next week, RNDR is expected to range between $1.20 and $1.44; a break below $1.20 risks accelerated downside, while resistance at $1.44 remains significant.
Bearish momentum confirmed over the week as indicators reinforce downside
Weekly technical analysis highlights continued bearish conditions, as RNDR trades below all major W1 moving averages without significant support in the current price zone. The nearest dynamic resistance is set at the Ichimoku Kijun at $1.5650. The RSI on the weekly chart stands at 42.56, reflecting mild downward momentum; weekly MACD and ADX signals confirm downside strength, while the Awesome Oscillator remains negative, further supporting the bearish outlook.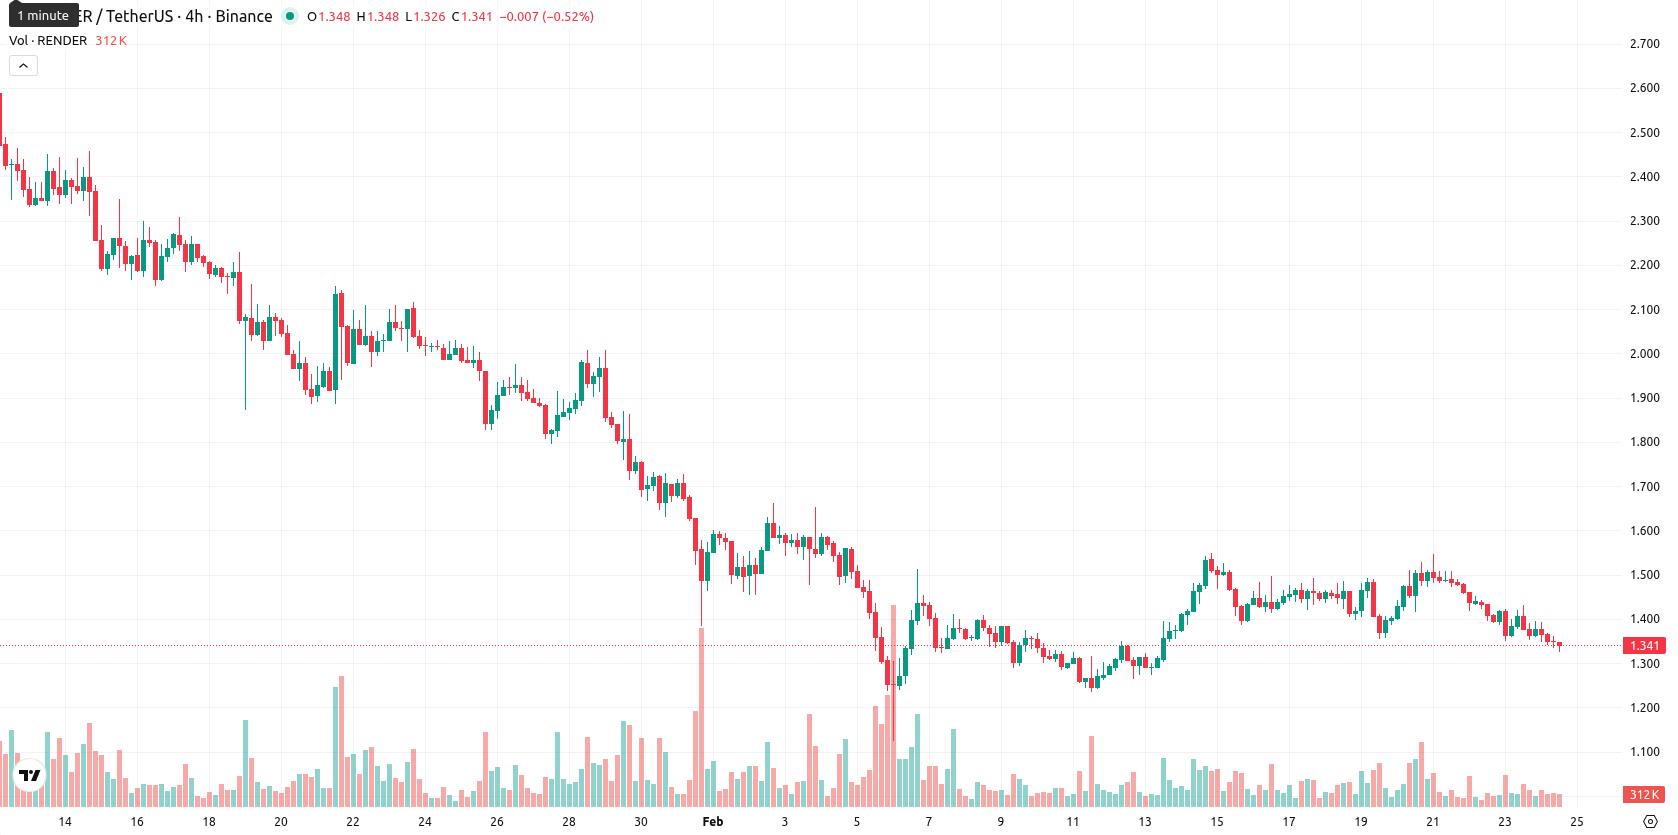
Downside bias for next week as resistance holds and volatility narrows
For the upcoming week, RNDR is expected to oscillate between $1.20 and $1.44, staying within a relatively narrow volatility band. Given the prevailing bearish signals across all weekly indicators, there is a strong probability that prices will remain soft or trend lower. Any bullish reversal would require a firm break above $1.44 resistance, which appears unlikely unless selling pressure eases. A move below $1.20 could trigger further declines, as there is little evidence of stabilization at current levels.
Viktoras Karapetjanc, analyst at Traders Union, sees that RNDR remained under sustained pressure this week, consistently trading below all key weekly moving averages. He notes that bearish momentum has persisted, with downside signals confirmed by MACD, ADX, and the Awesome Oscillator. Despite a challenging technical landscape, macro sentiment could shift quickly if sellers lose control. Karapetjanc believes a reversal above $1.44 would open opportunities for buyers, even though the base scenario favors continued consolidation or further softness. "As long as RNDR holds above $1.20, I remain constructive and see any upward momentum as a chance to position tactically for the next bullish cycle."
Last time, analysts noted that Render (RNDR) is demonstrating short-term bullishness, trading above its MA-20 but still facing resistance below its MA-50 and MA-200, with the next key resistance seen at the Ichimoku Kijun. While intraday buying pressure is evident and volatility remains high, broader momentum indicators such as MACD and ADX continue to suggest an overall bearish backdrop, leaving the asset technically fragile with key support and resistance levels framing its current range.
Source of Data:
RENDER Price Analysis by TU
The analysis is based on a proprietary model combining technical, on-chain, and expert data. Not investment advice. See
methodology
This material may contain third-party opinions, none of the data and information on this webpage constitutes investment advice according to our Disclaimer. While we adhere to strict Editorial Integrity, this post may contain references to products from our partners.
Subscribe to TU news


Did you like the article?






Top News


Top 5 companies for you

United States
-
 Afghanistan
-
 Albania
-
 Algeria
-
 Angola
-
 Argentina
-
 Armenia
-
 Australia
-
 Austria
-
 Azerbaijan
-
 Bahamas
-
 Bahrain
-
 Bangladesh
-
 Belarus
-
 Belgium
-
 Bolivia
-
 Botswana
-
 Brazil
-
 Brunei
-
 Bulgaria
-
 Cambodia
-
 Cameroon
-
 Canada
-
 Chile
-
 China
-
 Colombia
-
 Congo
-
 Costa Rica
-
 Cote d'Ivoire
-
 Croatia
-
 Cuba
-
 Cyprus
-
 Czechia
-
 DR Congo
-
 Denmark
-
 Dominican Republic
-
 Ecuador
-
 Egypt
-
 El Salvador
-
 Estonia
-
 Eswatini
-
 Ethiopia
-
 Finland
-
 France
-
 Georgia
-
 Germany
-
 Ghana
-
 Greece
-
 Haiti
-
 Hong Kong
-
 Hungary
-
 India
-
 Indonesia
-
 Iran, Islamic republic
-
 Iraq
-
 Ireland
-
 Israel
-
 Italy
-
 Jamaica
-
 Japan
-
 Jordan
-
 Kazakhstan
-
 Kenya
-
 Korea
-
 Kuwait
-
 Kyrgyzstan
-
 Laos
-
 Latvia
-
 Lebanon
-
 Lesotho
-
 Libya
-
 Lithuania
-
 Luxembourg
-
 Madagascar
-
 Malaysia
-
 Malta
-
 Mauritius
-
 Mexico
-
 Moldova
-
 Mongolia
-
 Montenegro
-
 Morocco
-
 Mozambique
-
 Myanmar
-
 Namibia
-
 Nepal
-
 Netherlands
-
 New Zealand
-
 Nigeria
-
 North Macedonia
-
 Norway
-
 Oman
-
 Pakistan
-
 Palestine
-
 Panama
-
 Papua New Guinea
-
 Paraguay
-
 Peru
-
 Philippines
-
 Poland
-
 Portugal
-
 Puerto Rico
-
 Qatar
-
 Reunion
-
 Romania
-
 Rwanda
-
 Saudi Arabia
-
 Serbia
-
 Singapore
-
 Slovakia
-
 Slovenia
-
 Somalia
-
 South Africa
-
 Spain
-
 Sri Lanka
-
 Sweden
-
 Switzerland
-
 Syria
-
 Taiwan
-
 Tajikistan
-
 Tanzania
-
 Thailand
-
 Trinidad and Tobago
-
 Tunisia
-
 Turkey
-
 UAE
-
 Uganda
-
 Ukraine
-
 United Kingdom
-
United States
-
 Uruguay
-
 Uzbekistan
-
 Venezuela
-
 Vietnam
-
 Yemen
-
 Zambia
-
 Zimbabwe
- Forex
- Crypto










Live News


