
VeChain price prediction: More downside ahead? VET falls below key resistance

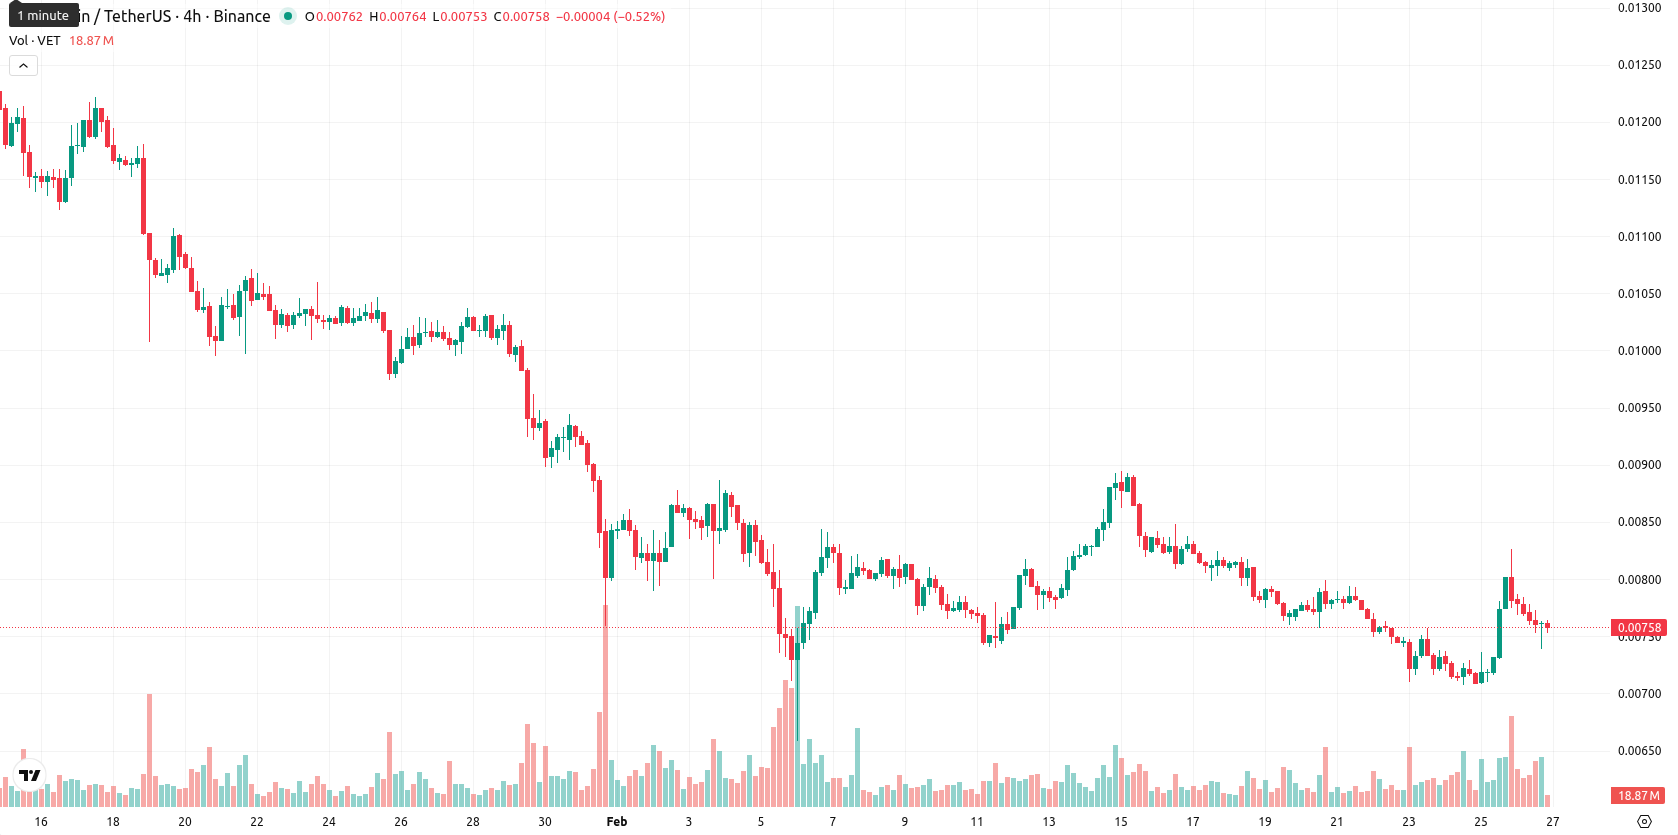
VeChain (VET) is currently trading at $0.007575, which is below the MA-20 ($0.007905), MA-50 ($0.009387), and MA-200 ($0.015943). This positioning indicates ongoing downward pressure across short-term, medium-term, and long-term trends, with sellers maintaining control. The Ichimoku Kijun level on D1 sits at $0.007940, above the current price, marking it as immediate resistance.
 0.004733
0.00501400
0.004733
0.00501400
Highlights
- VeChain (VET) trades at $0.007575, below key moving averages—MA-20 ($0.007905), MA-50 ($0.009387), and MA-200 ($0.015943)—indicating broad-based downward pressure.
- Momentum tools on D1—including a bearish MACD and a high ADX—confirm sellers remain dominant, with price sliding 7.28% in the latest session.
- A projected trading corridor is $0.00680–$0.00820 for the next five sessions, with resistance at $0.007940 (Ichimoku Kijun) and downside risk on a break below $0.00680.
Mixed short-term divergences as downside momentum dominates
Momentum indicators present a predominantly bearish picture on D1: the MACD signals a strong sell and the ADX confirms sellers are firmly in control. The RSI is in neutral-to-weak territory but not yet oversold, while the Stochastic RSI is elevated, indicating a short-term bounce or potential reversal attempt. The Commodity Channel Index is neutral, and Bull/Bear Power shows mild buyer activity, though this has not shifted the broader tone. The Awesome Oscillator is neutral, not reinforcing the ongoing down move. The session is clearly bearish, with the price sliding 7.28% and opening only slightly below the previous close, showing no material gap. Price is currently near the lower end of today’s range ($0.00739 – $0.007875), with intraday volatility running moderate to high and sellers dominating after the open. Several oscillators hint at possible short-term relief, but most momentum tools confirm intraday losses, highlighting a divergence.
Consolidation likely as bearish trend persists absent reversal triggers
Over the next five trading days, a typical volatility band relative to current levels spans from $0.00680 to $0.00820, respecting the 20% range normalization rule. There is a very low probability (less than 20%) of an upward reversal, with a much higher likelihood of continued decline, given all major weekly indicators remain bearish. The base case sees VET consolidating within this range. A bullish scenario would require a decisive move above immediate resistance at the Ichimoku Kijun ($0.007940), while a bearish break below $0.00680 would expose further downside.
Last time, analysts noted that VeChain is displaying signs of intraday recovery, with the price trading just above its short-term moving average but remaining below key longer-term averages, while oversold oscillator readings contrast with lingering bearish momentum from indicators like MACD and ADX. The asset faces dynamic resistance near the Ichimoku Kijun, and although buyer interest has emerged amid high volatility, uncertainty persists due to diverging signals between momentum and oscillators.








-
 Afghanistan
-
 Albania
-
 Algeria
-
 Angola
-
 Argentina
-
 Armenia
-
 Australia
-
 Austria
-
 Azerbaijan
-
 Bahamas
-
 Bahrain
-
 Bangladesh
-
 Belarus
-
 Belgium
-
 Bolivia
-
 Botswana
-
 Brazil
-
 Brunei
-
 Bulgaria
-
 Cambodia
-
 Cameroon
-
 Canada
-
 Chile
Chile
-
 China
China
-
 Colombia
-
 Congo
Congo
-
 Costa Rica
-
 Cote d'Ivoire
-
 Croatia
-
 Cuba
Cuba
-
 Cyprus
-
 Czechia
-
 DR Congo
-
 Denmark
-
 Dominican Republic
-
 Ecuador
-
 Egypt
Egypt
-
 El Salvador
-
 Estonia
-
 Eswatini
-
 Ethiopia
-
 Finland
-
 France
-
 Georgia
-
 Germany
-
 Ghana
Ghana
-
 Greece
-
 Haiti
Haiti
-
 Hong Kong
-
 Hungary
-
 India
India
-
 Indonesia
-
 Iran, Islamic republic
-
 Iraq
Iraq
-
 Ireland
-
 Israel
-
 Italy
Italy
-
 Jamaica
-
 Japan
Japan
-
 Jordan
-
 Kazakhstan
-
 Kenya
Kenya
-
 Korea
Korea
-
 Kuwait
-
 Kyrgyzstan
-
 Laos
Laos
-
 Latvia
-
 Lebanon
-
 Lesotho
-
 Libya
Libya
-
 Lithuania
-
 Luxembourg
-
 Madagascar
-
 Malaysia
-
 Malta
Malta
-
 Mauritius
-
 Mexico
-
 Moldova
-
 Mongolia
-
 Montenegro
-
 Morocco
-
 Mozambique
-
 Myanmar
-
 Namibia
-
 Nepal
Nepal
-
 Netherlands
-
 New Zealand
-
 Nigeria
-
 North Macedonia
-
 Norway
-
 Oman
Oman
-
 Pakistan
-
 Palestine
-
 Panama
-
 Papua New Guinea
-
 Paraguay
-
 Peru
Peru
-
 Philippines
-
 Poland
-
 Portugal
-
 Puerto Rico
-
 Qatar
Qatar
-
 Reunion
-
 Romania
-
 Rwanda
-
 Saudi Arabia
-
 Serbia
-
 Singapore
-
 Slovakia
-
 Slovenia
-
 Somalia
-
 South Africa
-
 Spain
Spain
-
 Sri Lanka
-
 Sweden
-
 Switzerland
-
 Syria
Syria
-
 Taiwan
-
 Tajikistan
-
 Tanzania
-
 Thailand
-
 Trinidad and Tobago
-
 Tunisia
-
 Turkey
-
 UAE
UAE
-
 Uganda
-
 Ukraine
-
 United Kingdom
-
United States
-
 Uruguay
-
 Uzbekistan
-
 Venezuela
-
 Vietnam
-
 Yemen
Yemen
-
 Zambia
-
 Zimbabwe
- Forex
- Crypto












