
Litecoin price prediction: Will ETF speculation offset bearish momentum? LTC drops below $53

Litecoin (LTC) is trading at $52.14, down 7.08% on the day and remaining well below its MA-20 ($54.10), MA-50 ($62.51), and MA-200 ($89.44) levels, indicating that selling pressure is dominant across all major timeframes. The current price sits near the session's lows and is constrained below the Ichimoku Kijun resistance at $53.23.
 47.69
47.90
47.69
47.90
Highlights
- Large Litecoin holders accumulated 1.02 million tokens on February 8, 2026, raising their total from 6.13 million to 7.15 million ahead of the SEC review of a T. Rowe Price ETF application.
- Despite accumulation activity, Litecoin price remains under selling pressure as market participants await an SEC decision on the proposed ETF.
- Litecoin is trading below key MAs (MA-20: $54.10, MA-50: $62.51, MA-200: $89.44) with strong downside momentum and next-week range expected at $47–$57.
Accumulation by large holders as ETF review prompts positioning
In connection with a reviewed ETF application by T. Rowe Price, large wallet holders were reported accumulating 1.02 million Litecoin on February 8, 2026, increasing their total holdings from 6.13 million to 7.15 million tokens. This activity occurred ahead of the ongoing SEC review of a Litecoin-related ETF application, though price action has remained under broader selling pressure.
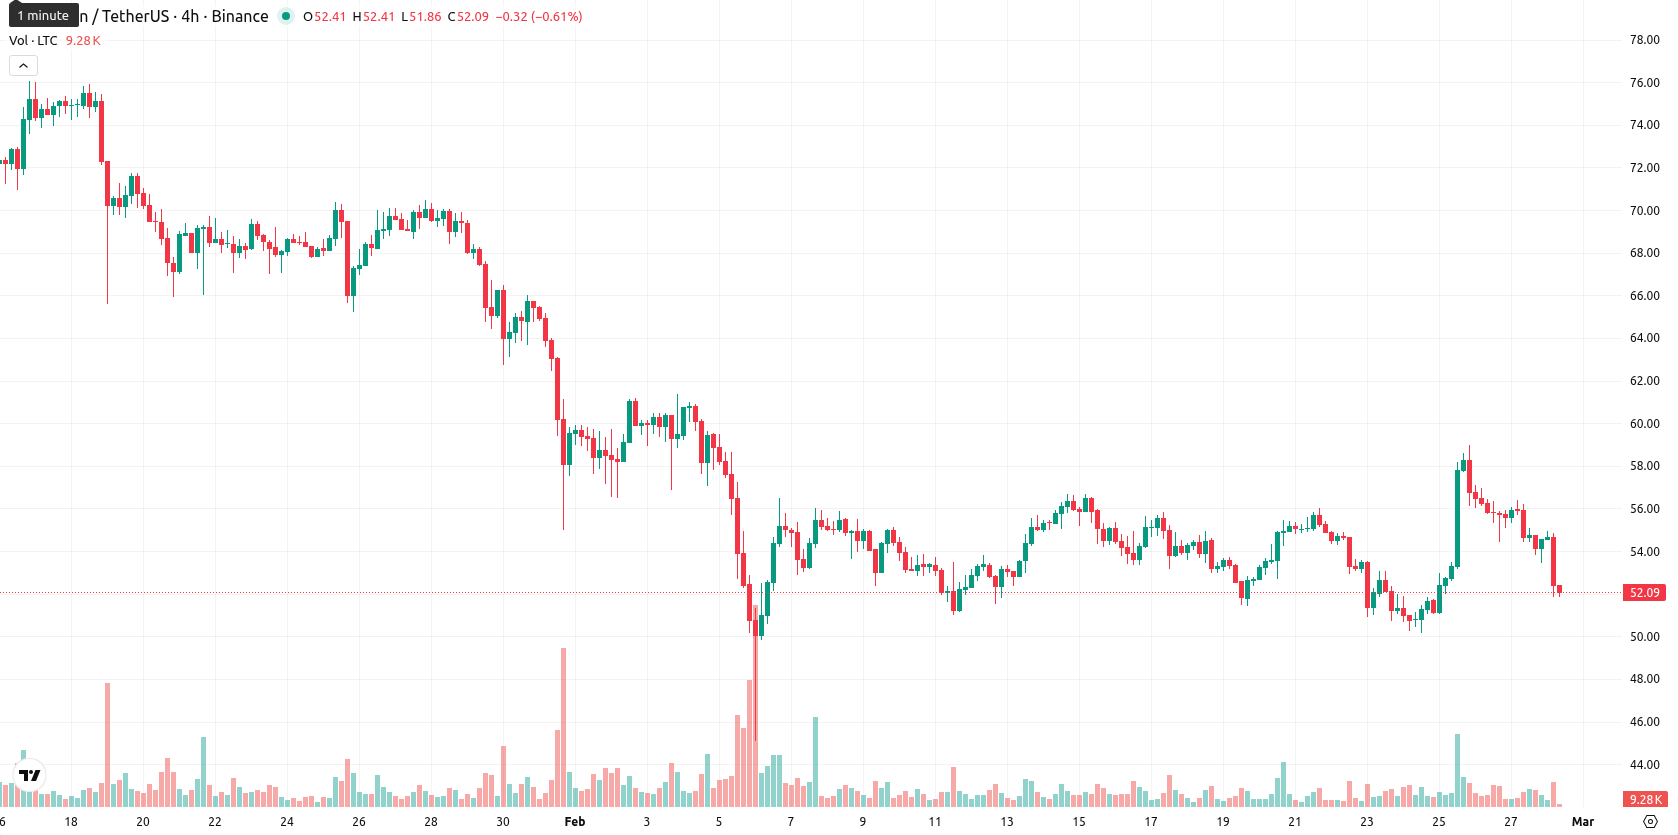
Downside momentum accelerates as major technical levels breach
Technical analysis indicates that LTC is under sustained selling pressure, with the asset trading well below its MA-20, MA-50, and MA-200, pointing to weakness across short-, medium-, and long-term timeframes. Resistance now lies at the Ichimoku Kijun level ($53.23), just above the current price. Key momentum indicators — including the MACD and ADX — both signal strong downside momentum, while RSI and Stochastic RSI readings are firmly bearish or oversold. The Commodity Channel Index also shows a selling bias, and Bull/Bear Power readings, while still overbought, are losing strength, confirming continued seller dominance in the intraday session.
Sideways consolidation likely as volatility bands tighten
Over the next five trading days, LTC is expected to trade within a volatility band of $47–$57, reflecting the asset’s typical price swings around current levels. There is a very low probability (less than 20%) of a price increase in the short term. The baseline scenario calls for continued sideways consolidation near recent lows, while a break above resistance at $53.23 could trigger a recovery toward $57. A decisive move below $51–$50 would expose fresh lows targeting $47 or below if negative momentum persists.
Litecoin is trading above its short-term moving average but remains below both the 50-day and 200-day MAs, with technical indicators reflecting persistent selling pressure and oversold conditions despite a strong intraday rally. On-chain activity and active addresses have increased, yet the price faces resistance near $64.11 and support around $55.77, pointing to ongoing volatility and an unstable market outlook.









-
 Afghanistan
-
 Albania
-
 Algeria
-
 Angola
-
 Argentina
-
 Armenia
-
 Australia
-
 Austria
-
 Azerbaijan
-
 Bahamas
-
 Bahrain
-
 Bangladesh
-
 Belarus
-
 Belgium
-
 Bolivia
-
 Botswana
-
 Brazil
-
 Brunei
-
 Bulgaria
-
 Cambodia
-
 Cameroon
-
 Canada
-
 Chile
Chile
-
 China
China
-
 Colombia
-
 Congo
Congo
-
 Costa Rica
-
 Cote d'Ivoire
-
 Croatia
-
 Cuba
Cuba
-
 Cyprus
-
 Czechia
-
 DR Congo
-
 Denmark
-
 Dominican Republic
-
 Ecuador
-
 Egypt
Egypt
-
 El Salvador
-
 Estonia
-
 Eswatini
-
 Ethiopia
-
 Finland
-
 France
-
 Georgia
-
 Germany
-
 Ghana
Ghana
-
 Greece
-
 Haiti
Haiti
-
 Hong Kong
-
 Hungary
-
 India
India
-
 Indonesia
-
 Iran, Islamic republic
-
 Iraq
Iraq
-
 Ireland
-
 Israel
-
 Italy
Italy
-
 Jamaica
-
 Japan
Japan
-
 Jordan
-
 Kazakhstan
-
 Kenya
Kenya
-
 Korea
Korea
-
 Kuwait
-
 Kyrgyzstan
-
 Laos
Laos
-
 Latvia
-
 Lebanon
-
 Lesotho
-
 Libya
Libya
-
 Lithuania
-
 Luxembourg
-
 Madagascar
-
 Malaysia
-
 Malta
Malta
-
 Mauritius
-
 Mexico
-
 Moldova
-
 Mongolia
-
 Montenegro
-
 Morocco
-
 Mozambique
-
 Myanmar
-
 Namibia
-
 Nepal
Nepal
-
 Netherlands
-
 New Zealand
-
 Nigeria
-
 North Macedonia
-
 Norway
-
 Oman
Oman
-
 Pakistan
-
 Palestine
-
 Panama
-
 Papua New Guinea
-
 Paraguay
-
 Peru
Peru
-
 Philippines
-
 Poland
-
 Portugal
-
 Puerto Rico
-
 Qatar
Qatar
-
 Reunion
-
 Romania
-
 Rwanda
-
 Saudi Arabia
-
 Serbia
-
 Singapore
-
 Slovakia
-
 Slovenia
-
 Somalia
-
 South Africa
-
 Spain
Spain
-
 Sri Lanka
-
 Sweden
-
 Switzerland
-
 Syria
Syria
-
 Taiwan
-
 Tajikistan
-
 Tanzania
-
 Thailand
-
 Trinidad and Tobago
-
 Tunisia
-
 Turkey
-
 UAE
UAE
-
 Uganda
-
 Ukraine
-
 United Kingdom
-
United States
-
 Uruguay
-
 Uzbekistan
-
 Venezuela
-
 Vietnam
-
 Yemen
Yemen
-
 Zambia
-
 Zimbabwe
- Forex
- Crypto











