
Ethereum Classic price prediction: Will resistance hold or ETC fall further?

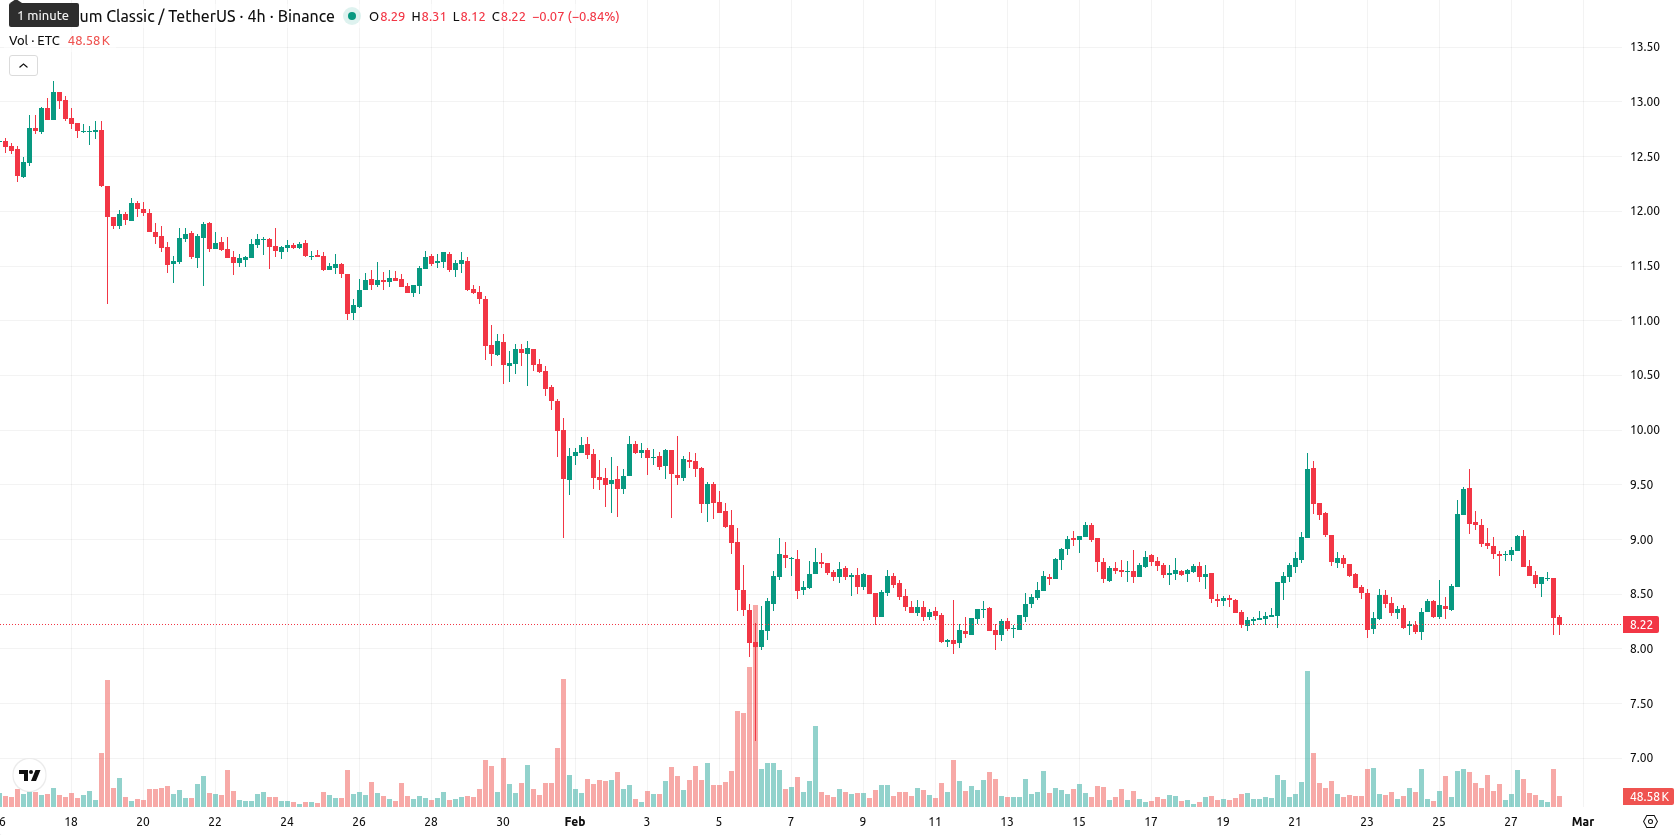
Ethereum Classic (ETC) is trading at $8.14 after a daily decline of 9.35%. The asset remains below its MA-20 ($8.6005), MA-50 ($10.1916), and MA-200 ($15.0887), highlighting persistent downward pressure across all observed timeframes.
 7
7.230000
7
7.230000
Highlights
- Ethereum Classic trades at $8.14, below all major moving averages (MA-20 at $8.6005, MA-50 at $10.1916, MA-200 at $15.0887), confirming strong downward pressure.
- Momentum indicators (MACD, ADX) remain on sell signals and RSI sits at 44, supporting a bearish trend despite minor intraday buyer support.
- Immediate resistance is $8.545 (Ichimoku Kijun); key range for next five days is $7.30–$8.90 with less than 20% probability of a price increase.
Sustained bearish momentum as sell signals dominate technicals
Technical momentum for ETC remains negative, with the price trading under major moving averages and facing immediate resistance from the Ichimoku Kijun at $8.545. MACD and ADX continue to register daily sell signals, confirming strong bearish momentum; RSI sits at 44 and is mildly bearish but not oversold. Stochastic RSI and CCI show neutral readings with oversold conditions on shorter intervals, while Bull/Bear Power provides only modest buyer support intraday. Despite some buyer activity, overall momentum indicators and current price action confirm that sellers remain firmly in control.
Sideways consolidation expected as volatility band holds
In the short term, ETC is expected to move within a volatility band of $7.30 to $8.90 over the next five trading days. Weekly indicators across all major metrics remain on sell signals, limiting the likelihood of any price rebound to under 20%. The most probable scenario is a sideways consolidation between $7.30 and $8.90. A break above $8.55 would open up a move toward $8.90, while a fall below $7.30 may extend losses toward the band’s lower edge.
Last time, analysts noted that Ethereum Classic is consolidating above its short-term moving average but remains pressured below key medium- and long-term averages, with technical signals reflecting sustained bearish momentum and immediate resistance at the $8.90 level. Downside risk prevails amid weak bullish attempts, with the price expected to remain range-bound between $7.00 and $9.00, as strong sell signals from MACD and ADX reinforce the likelihood of further decline or sideways movement.


Latest Ethereum Classic (ETC) News






-
 Afghanistan
-
 Albania
-
 Algeria
-
 Angola
-
 Argentina
-
 Armenia
-
 Australia
-
 Austria
-
 Azerbaijan
-
 Bahamas
-
 Bahrain
-
 Bangladesh
-
 Belarus
-
 Belgium
-
 Bolivia
-
 Botswana
-
 Brazil
-
 Brunei
-
 Bulgaria
-
 Cambodia
-
 Cameroon
-
 Canada
-
 Chile
Chile
-
 China
China
-
 Colombia
-
 Congo
Congo
-
 Costa Rica
-
 Cote d'Ivoire
-
 Croatia
-
 Cuba
Cuba
-
 Cyprus
-
 Czechia
-
 DR Congo
-
 Denmark
-
 Dominican Republic
-
 Ecuador
-
 Egypt
Egypt
-
 El Salvador
-
 Estonia
-
 Eswatini
-
 Ethiopia
-
 Finland
-
 France
-
 Georgia
-
 Germany
-
 Ghana
Ghana
-
 Greece
-
 Haiti
Haiti
-
 Hong Kong
-
 Hungary
-
 India
India
-
 Indonesia
-
 Iran, Islamic republic
-
 Iraq
Iraq
-
 Ireland
-
 Israel
-
 Italy
Italy
-
 Jamaica
-
 Japan
Japan
-
 Jordan
-
 Kazakhstan
-
 Kenya
Kenya
-
 Korea
Korea
-
 Kuwait
-
 Kyrgyzstan
-
 Laos
Laos
-
 Latvia
-
 Lebanon
-
 Lesotho
-
 Libya
Libya
-
 Lithuania
-
 Luxembourg
-
 Madagascar
-
 Malaysia
-
 Malta
Malta
-
 Mauritius
-
 Mexico
-
 Moldova
-
 Mongolia
-
 Montenegro
-
 Morocco
-
 Mozambique
-
 Myanmar
-
 Namibia
-
 Nepal
Nepal
-
 Netherlands
-
 New Zealand
-
 Nigeria
-
 North Macedonia
-
 Norway
-
 Oman
Oman
-
 Pakistan
-
 Palestine
-
 Panama
-
 Papua New Guinea
-
 Paraguay
-
 Peru
Peru
-
 Philippines
-
 Poland
-
 Portugal
-
 Puerto Rico
-
 Qatar
Qatar
-
 Reunion
-
 Romania
-
 Rwanda
-
 Saudi Arabia
-
 Serbia
-
 Singapore
-
 Slovakia
-
 Slovenia
-
 Somalia
-
 South Africa
-
 Spain
Spain
-
 Sri Lanka
-
 Sweden
-
 Switzerland
-
 Syria
Syria
-
 Taiwan
-
 Tajikistan
-
 Tanzania
-
 Thailand
-
 Trinidad and Tobago
-
 Tunisia
-
 Turkey
-
 UAE
UAE
-
 Uganda
-
 Ukraine
-
 United Kingdom
-
United States
-
 Uruguay
-
 Uzbekistan
-
 Venezuela
-
 Vietnam
-
 Yemen
Yemen
-
 Zambia
-
 Zimbabwe
- Forex
- Crypto











