
-7.46% for JasmyCoin — Sellers control intraday action amid oversold conditions

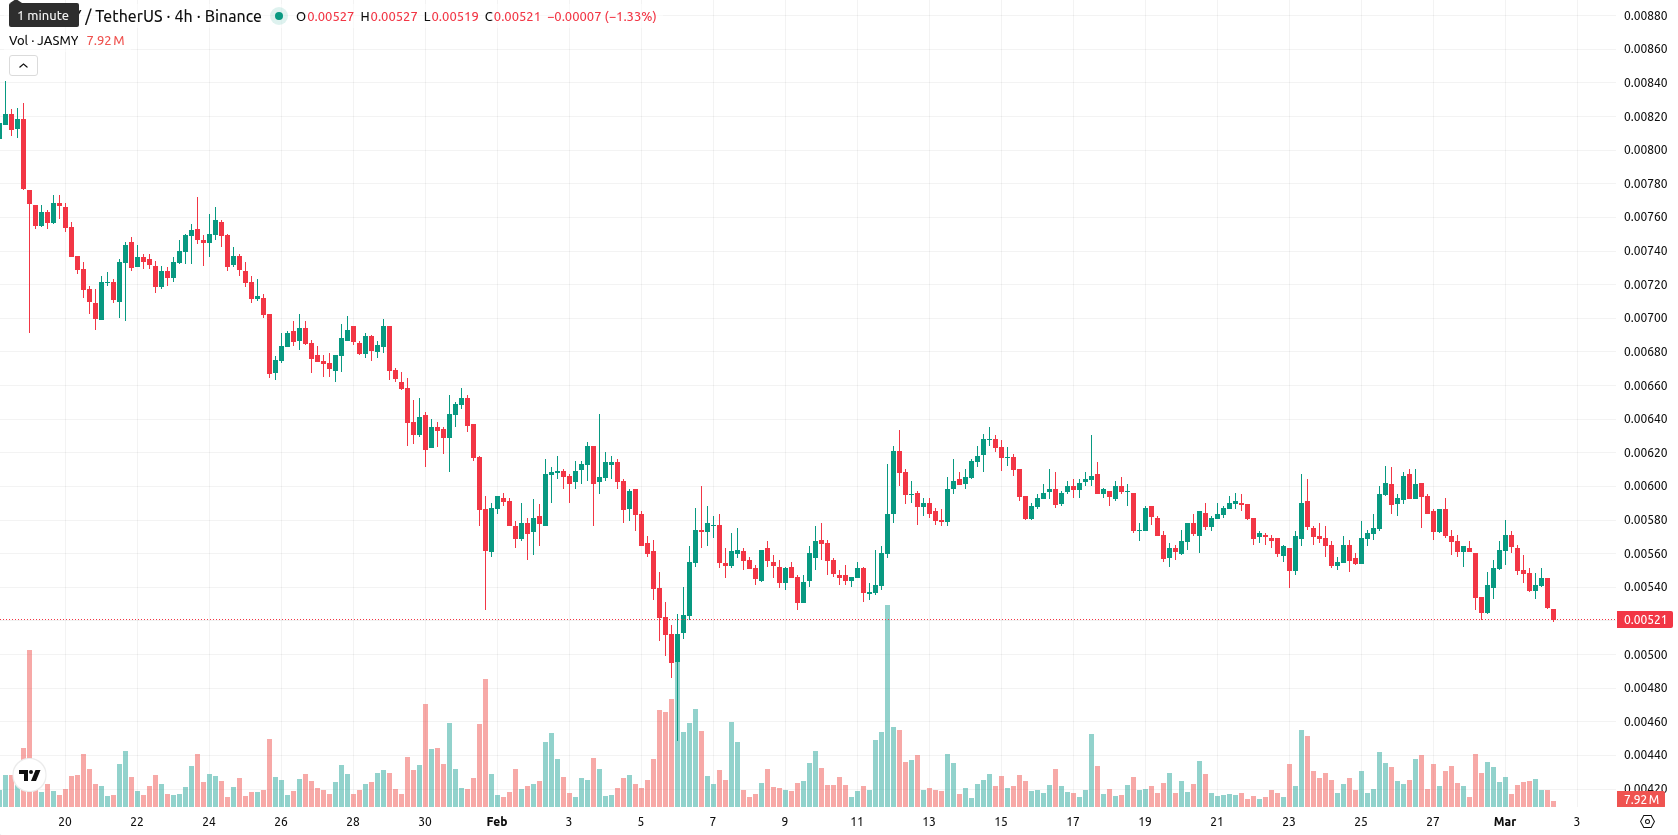
JasmyCoin (JASMY) is trading at $0.00521, showing a daily decline of 7.46%. The asset is positioned below the MA-20 ($0.005772), MA-50 ($0.006484), and MA-200 ($0.009467), which confirms continued seller pressure across short, medium, and long-term trends.
 0.00479
0.004910
0.00479
0.004910
Highlights
- JasmyCoin trades at $0.00521, well below the MA-20 ($0.005772), MA-50 ($0.006484), and MA-200 ($0.009467), confirming pervasive seller pressure.
- Momentum and trend indicators—including MACD (strong sell), ADX (21), and Awesome Oscillator—signal a decisively negative, seller-dominated environment.
- The 5-day price range projects $0.00470–$0.00570, with critical resistance at $0.00543 (Ichimoku Kijun) and increased downside risk if $0.00470 is breached.
Momentum deteriorates as oversold signals persist below resistance
The technical backdrop for JASMY remains negative, with price trading under major moving averages and the Ichimoku Kijun at $0.005425 putting immediate resistance just above current levels. Momentum indicators reinforce this weakness: MACD signals a strong sell, the ADX at 21 indicates a weak but developing trend, and both RSI and Commodity Channel Index report oversold conditions. The Stochastic RSI is similarly oversold, which occasionally precedes short-term rebounds but currently points to persistent weakness. Intraday momentum is still controlled by sellers, as shown by negative Bull/Bear Power and a declining Awesome Oscillator, while price drifts toward the lower end of the intraday range ($0.00526 – $0.0055) amid high volatility.
Downside risk prevails as technicals limit upside scenario
For the coming five trading days, the typical volatility band for JASMY is estimated at $0.00470 – $0.00570, with the current price near the middle of this range. The likelihood of a sustained upside move is low (below 20%), reflecting strong consensus among weekly trend and momentum indicators for further downside. The baseline scenario expects movement in a sideways corridor within this volatility band. An upside scenario requires a break above $0.00543 (Ichimoku Kijun), while a fall below $0.00470 would confirm further downside risk.
Last time, analysts noted that JasmyCoin remains under persistent bearish pressure, with the price trading below all key moving averages and failing to overcome immediate resistance at the Ichimoku Kijun, while major momentum indicators (MACD, ADX, RSI, Stochastic RSI) reinforce a prevailing sell bias. The outlook points to continued downside risk and limited rebound odds unless the price can reclaim both the Ichimoku and short-term moving average levels.


Latest JasmyCoin News






-
 Afghanistan
-
 Albania
-
 Algeria
-
 Angola
-
 Argentina
-
 Armenia
-
 Australia
-
 Austria
-
 Azerbaijan
-
 Bahamas
-
 Bahrain
-
 Bangladesh
-
 Belarus
-
 Belgium
-
 Bolivia
-
 Botswana
-
 Brazil
-
 Brunei
-
 Bulgaria
-
 Cambodia
-
 Cameroon
-
 Canada
-
 Chile
Chile
-
 China
China
-
 Colombia
-
 Congo
Congo
-
 Costa Rica
-
 Cote d'Ivoire
-
 Croatia
-
 Cuba
Cuba
-
 Cyprus
-
 Czechia
-
 DR Congo
-
 Denmark
-
 Dominican Republic
-
 Ecuador
-
 Egypt
Egypt
-
 El Salvador
-
 Estonia
-
 Eswatini
-
 Ethiopia
-
 Finland
-
 France
-
 Georgia
-
 Germany
-
 Ghana
Ghana
-
 Greece
-
 Haiti
Haiti
-
 Hong Kong
-
 Hungary
-
 India
India
-
 Indonesia
-
 Iran, Islamic republic
-
 Iraq
Iraq
-
 Ireland
-
 Israel
-
 Italy
Italy
-
 Jamaica
-
 Japan
Japan
-
 Jordan
-
 Kazakhstan
-
 Kenya
Kenya
-
 Korea
Korea
-
 Kuwait
-
 Kyrgyzstan
-
 Laos
Laos
-
 Latvia
-
 Lebanon
-
 Lesotho
-
 Libya
Libya
-
 Lithuania
-
 Luxembourg
-
 Madagascar
-
 Malaysia
-
 Malta
Malta
-
 Mauritius
-
 Mexico
-
 Moldova
-
 Mongolia
-
 Montenegro
-
 Morocco
-
 Mozambique
-
 Myanmar
-
 Namibia
-
 Nepal
Nepal
-
 Netherlands
-
 New Zealand
-
 Nigeria
-
 North Macedonia
-
 Norway
-
 Oman
Oman
-
 Pakistan
-
 Palestine
-
 Panama
-
 Papua New Guinea
-
 Paraguay
-
 Peru
Peru
-
 Philippines
-
 Poland
-
 Portugal
-
 Puerto Rico
-
 Qatar
Qatar
-
 Reunion
-
 Romania
-
 Rwanda
-
 Saudi Arabia
-
 Serbia
-
 Singapore
-
 Slovakia
-
 Slovenia
-
 Somalia
-
 South Africa
-
 Spain
Spain
-
 Sri Lanka
-
 Sweden
-
 Switzerland
-
 Syria
Syria
-
 Taiwan
-
 Tajikistan
-
 Tanzania
-
 Thailand
-
 Trinidad and Tobago
-
 Tunisia
-
 Turkey
-
 UAE
UAE
-
 Uganda
-
 Ukraine
-
 United Kingdom
-
United States
-
 Uruguay
-
 Uzbekistan
-
 Venezuela
-
 Vietnam
-
 Yemen
Yemen
-
 Zambia
-
 Zimbabwe
- Forex
- Crypto











