
Ethena: Rangebound forecast and weak buyers drive fresh price decline

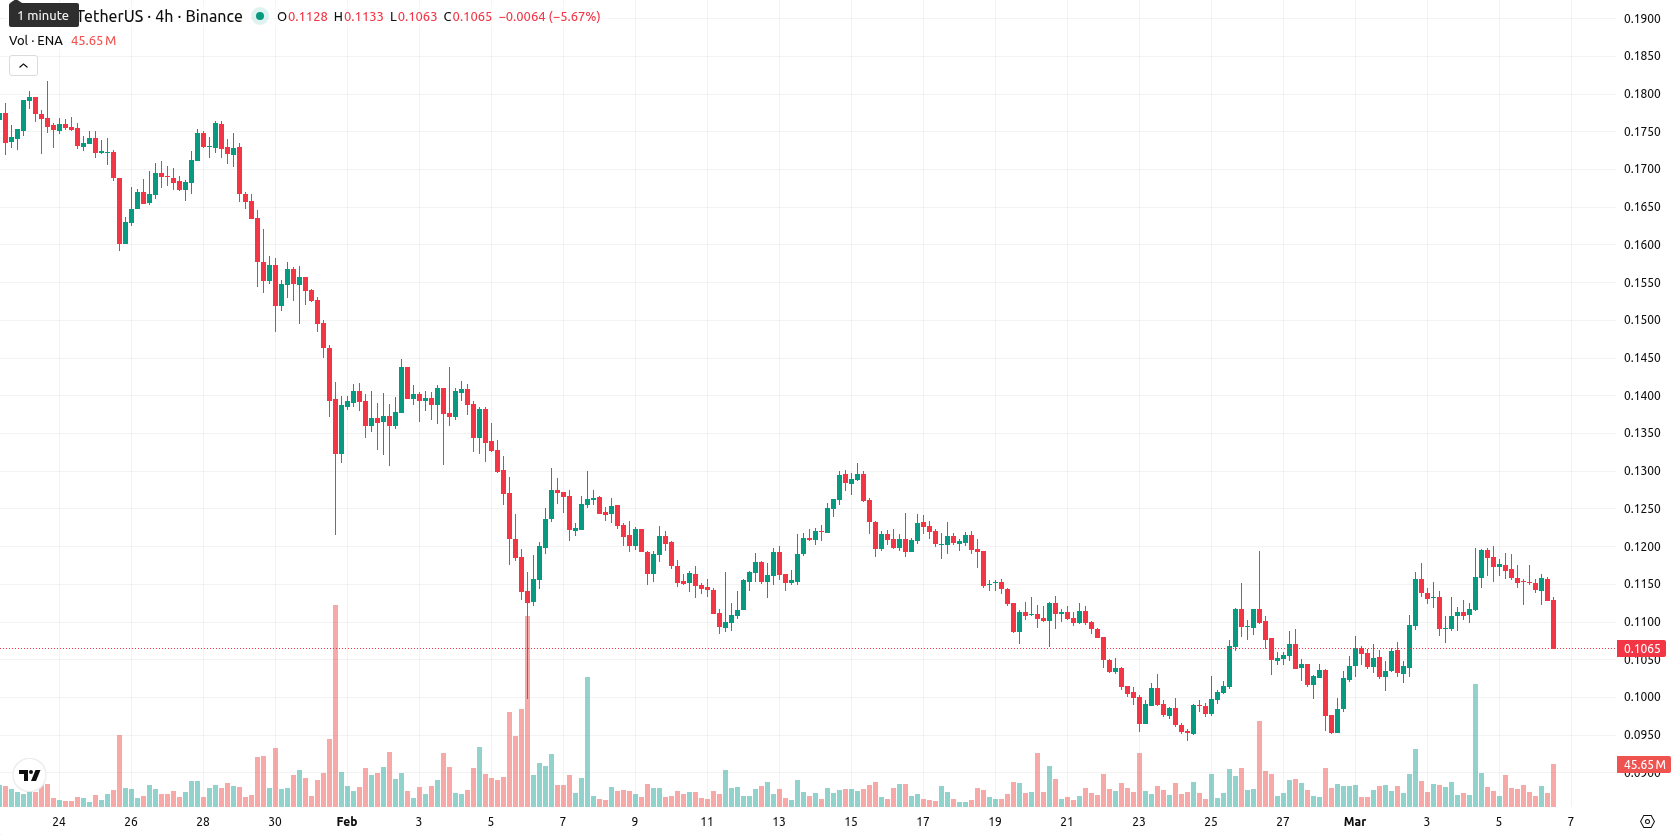
Ethena (ENA) is trading at $0.107, down 7.04% for the day. The price sits below its MA-20 at $0.1109, MA-50 at $0.1383, and MA-200 at $0.3548, indicating persistent seller pressure across short-, medium-, and long-term timeframes. The Ichimoku Kijun at $0.1126 stands above the market price, marking immediate resistance.
Highlights
- Ethena's synthetic dollar platform uses delta-neutral strategies with staked Ethereum and perpetuals to deliver price stability and yield.
- ENA token utility and protocol value are sensitive to regulatory changes around synthetic assets, with total value locked crucial for revenue dynamics.
- ENA trades under key moving averages amid persistent selling, with next week's range seen at $0.096-$0.118 and downside pressure prevailing unless $0.1126 is reclaimed.
Protocol’s value flows and governance face regulatory risk amid selloff
Analyses of the Ethena protocol have focused on its synthetic dollar platform, which uses delta-neutral hedging with staked Ethereum derivatives and perpetual futures to deliver price stability and yield. The ENA token is used for governance and accrues value within a maximum supply of 15 billion tokens, with allocations toward contributors, ecosystem development, the foundation treasury, and community incentives. Total value locked in the protocol is a key measure of its health, directly affecting revenue from staking and arbitrage, while regulatory actions related to synthetic assets, derivatives trading, or decentralized finance governance may alter operational dynamics or token utility, though price action has remained under broader selling pressure.
Bearish momentum dominates as mixed signals temper short-term optimism
Momentum signals on ENA remain bearish on the daily timeframe, with the MACD pointing to pronounced downside and the ADX confirming a strong selling trend. The RSI is weak, while the Stochastic RSI is in overbought territory and the Commodity Channel Index is neutral, resulting in mixed signals for short-term exhaustion versus ongoing weakness. Bull/Bear Power stays positive, reflecting buyer participation against the selling trend, but price is near today’s lows with a notable intraday decline, indicating persistent pressure.
Limited rally scope as downside risk grows without resistance breach
In the short term, ENA is expected to move within a range of $0.096 to $0.118, reflecting a typical volatility band relative to current levels. Upside potential is limited, with less than a 20% chance of a sustained rally as strong sell signals persist across weekly moving averages, RSI, ADX, and MACD. The baseline scenario calls for rangebound trading, while a recovery would require a break above the Ichimoku Kijun at $0.1126. Failure to hold recent lows could see further downside, with prevailing risks favoring sellers unless buyers reclaim short-term resistance.
Last time, analysts noted that Ethena (ENA) is experiencing short-term upward momentum as it trades above its MA-20, but it remains below key longer-term moving averages, indicating the broader trend is still bearish. Key technical indicators—including bearish MACD, elevated ADX, and low RSI—signal continued downside risk, with immediate resistance at the Ichimoku Kijun and heightened volatility suggesting further choppy price action ahead.


Latest Ethena News


-
 Afghanistan
-
 Albania
-
 Algeria
-
 Angola
-
 Argentina
-
 Armenia
-
 Australia
-
 Austria
-
 Azerbaijan
-
 Bahamas
-
 Bahrain
-
 Bangladesh
-
 Belarus
-
 Belgium
-
 Bolivia
-
 Botswana
-
 Brazil
-
 Brunei
-
 Bulgaria
-
 Cambodia
-
 Cameroon
-
 Canada
-
 Chile
Chile
-
 China
China
-
 Colombia
-
 Congo
Congo
-
 Costa Rica
-
 Cote d'Ivoire
-
 Croatia
-
 Cuba
Cuba
-
 Cyprus
-
 Czechia
-
 DR Congo
-
 Denmark
-
 Dominican Republic
-
 Ecuador
-
 Egypt
Egypt
-
 El Salvador
-
 Estonia
-
 Eswatini
-
 Ethiopia
-
 Finland
-
 France
-
 Georgia
-
 Germany
-
 Ghana
Ghana
-
 Greece
-
 Haiti
Haiti
-
 Hong Kong
-
 Hungary
-
 India
India
-
 Indonesia
-
 Iran, Islamic republic
-
 Iraq
Iraq
-
 Ireland
-
 Israel
-
 Italy
Italy
-
 Jamaica
-
 Japan
Japan
-
 Jordan
-
 Kazakhstan
-
 Kenya
Kenya
-
 Korea
Korea
-
 Kuwait
-
 Kyrgyzstan
-
 Laos
Laos
-
 Latvia
-
 Lebanon
-
 Lesotho
-
 Libya
Libya
-
 Lithuania
-
 Luxembourg
-
 Madagascar
-
 Malaysia
-
 Malta
Malta
-
 Mauritius
-
 Mexico
-
 Moldova
-
 Mongolia
-
 Montenegro
-
 Morocco
-
 Mozambique
-
 Myanmar
-
 Namibia
-
 Nepal
Nepal
-
 Netherlands
-
 New Zealand
-
 Nigeria
-
 North Macedonia
-
 Norway
-
 Oman
Oman
-
 Pakistan
-
 Palestine
-
 Panama
-
 Papua New Guinea
-
 Paraguay
-
 Peru
Peru
-
 Philippines
-
 Poland
-
 Portugal
-
 Puerto Rico
-
 Qatar
Qatar
-
 Reunion
-
 Romania
-
 Rwanda
-
 Saudi Arabia
-
 Serbia
-
 Singapore
-
 Slovakia
-
 Slovenia
-
 Somalia
-
 South Africa
-
 Spain
Spain
-
 Sri Lanka
-
 Sweden
-
 Switzerland
-
 Syria
Syria
-
 Taiwan
-
 Tajikistan
-
 Tanzania
-
 Thailand
-
 Trinidad and Tobago
-
 Tunisia
-
 Turkey
-
 UAE
UAE
-
 Uganda
-
 Ukraine
-
 United Kingdom
-
United States
-
 Uruguay
-
 Uzbekistan
-
 Venezuela
-
 Vietnam
-
 Yemen
Yemen
-
 Zambia
-
 Zimbabwe
- Forex
- Crypto
