
Dogecoin shares slip as oversold oscillators highlight bearish momentum – weekly forecast

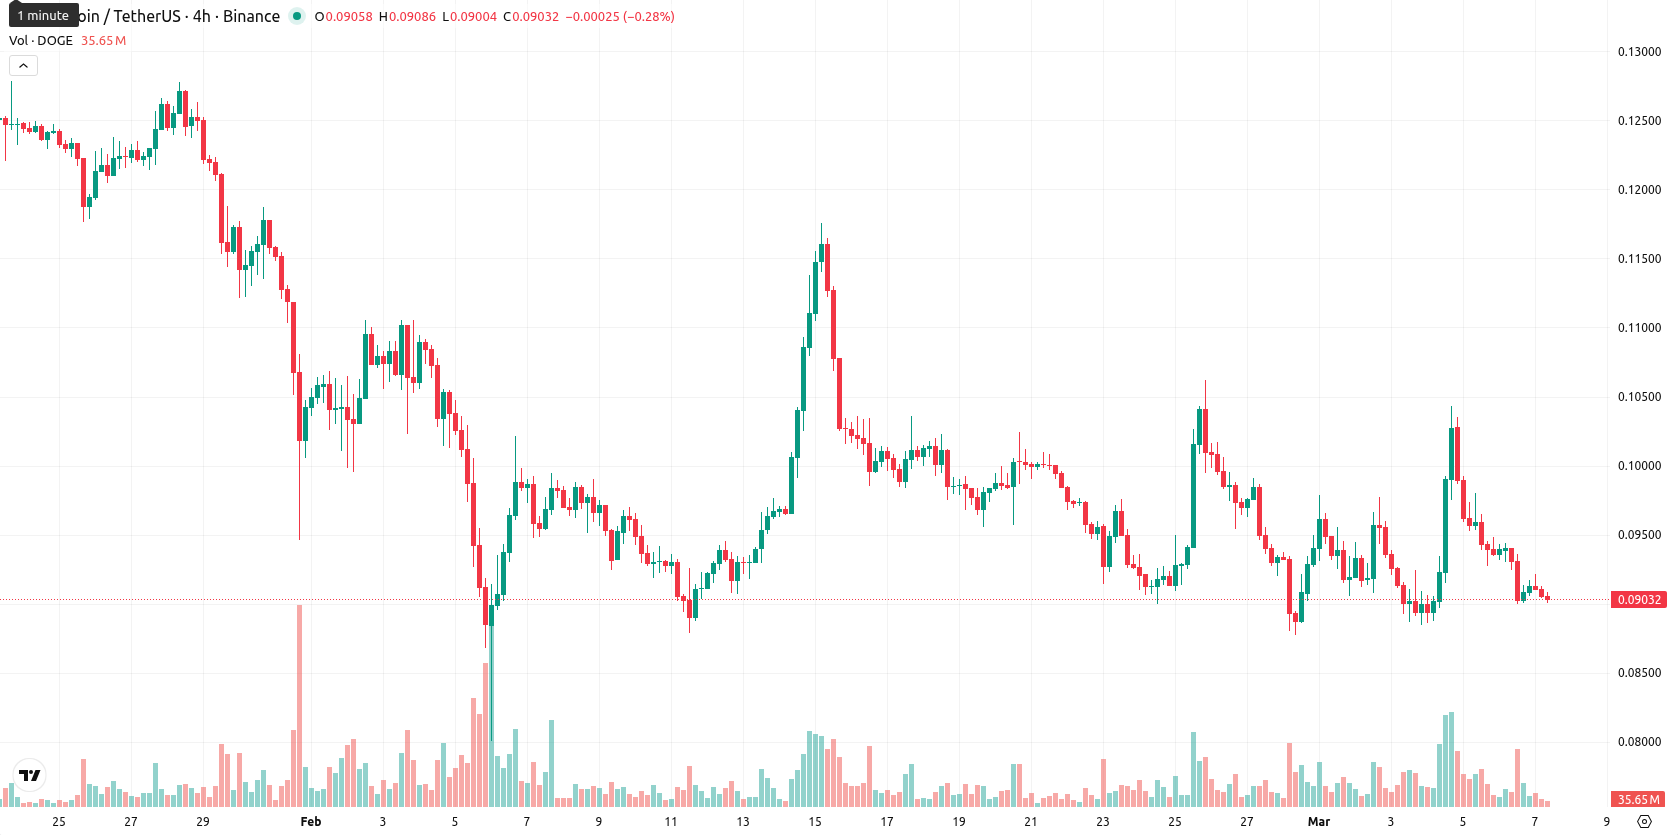
Dogecoin (DOGE) is currently trading at $0.09039, ending the week down 1.64% from the weekly open and holding well below its key weekly moving averages: MA-20 ($0.13349), MA-50 ($0.17750), and MA-200 ($0.13562). This persistent underperformance relative to major trend levels underscores ongoing seller dominance and confirms a bearish stance on both medium- and long-term timeframes.
 0.07448
0.07938
0.07448
0.07938
Highlights
- Dogecoin maintains a bearish trend, trading well below major moving averages, with sellers firmly in control.
- Momentum indicators register oversold readings as weekly losses accelerate, confirming persistent downward pressure and weak short-term sentiment.
- DOGE is expected to range between $0.08150 and $0.09930 over the next week, with high odds of further decline unless key resistance is reclaimed.
ETF launches boost volumes as institutional flows contrast with structural limits
The recent launch of the 21Shares Dogecoin spot ETF (TDOG) on Nasdaq and the Grayscale Dogecoin ETF (GDOG) on NYSE Arca has driven institutional access to the token through traditional platforms. Trading volumes surged, with over $2.5 billion exchanged in 24 hours and inflows into newly listed Dogecoin ETFs totaling just over $7 million. Despite continued adoption for online tipping, Dogecoin faces structural constraints such as a lack of DeFi products and few protocol upgrades. Social media attention and references from high-profile figures continue to play a secondary role in market sentiment.
Oversold signals rise as sustained bearish momentum defines the week
Weekly technical momentum remains negative as DOGE trades below all major moving averages on the W1 chart, with the nearest dynamic resistance at the MA-20 ($0.13349). Technical support is observed near $0.08150, while resistance is set around $0.09930. Oscillators highlight oversold conditions — weekly RSI is at 33, Stochastic RSI and CCI both show oversold signals, and the MACD, ADX, and Bull/Bear Power all confirm bearish momentum. The Awesome Oscillator also aligns with this downward trend, and weekly volatility is elevated at 17.94%.
Renewed downside likely this week as oversold signals meet weak momentum
For the coming week, the most likely scenario is sideways movement between $0.08150 and $0.09930, as oversold signals on weekly oscillators may prompt some short-term stabilization. However, with continued negative momentum and no buy signals from primary indicators, there is a much higher probability of renewed downside and a break below support if selling persists. A bullish scenario would require a sustained breakout above $0.09930, but this is seen as unlikely given the current market posture.
Last time, analysts noted that Dogecoin was trading below key moving averages with bearish momentum prevailing, while mixed signals from momentum indicators such as MACD and RSI suggested short-term indecision amid overall downside risk. Immediate resistance was identified near the Ichimoku Kijun, and prices were expected to consolidate within a defined range unless a breakout above key resistance or a drop below recent support occurred.















-
 Afghanistan
-
 Albania
-
 Algeria
-
 Angola
-
 Argentina
-
 Armenia
-
 Australia
-
 Austria
-
 Azerbaijan
-
 Bahamas
-
 Bahrain
-
 Bangladesh
-
 Belarus
-
 Belgium
-
 Bolivia
-
 Botswana
-
 Brazil
-
 Brunei
-
 Bulgaria
-
 Cambodia
-
 Cameroon
-
 Canada
-
 Chile
Chile
-
 China
China
-
 Colombia
-
 Congo
Congo
-
 Costa Rica
-
 Cote d'Ivoire
-
 Croatia
-
 Cuba
Cuba
-
 Cyprus
-
 Czechia
-
 DR Congo
-
 Denmark
-
 Dominican Republic
-
 Ecuador
-
 Egypt
Egypt
-
 El Salvador
-
 Estonia
-
 Eswatini
-
 Ethiopia
-
 Finland
-
 France
-
 Georgia
-
 Germany
-
 Ghana
Ghana
-
 Greece
-
 Haiti
Haiti
-
 Hong Kong
-
 Hungary
-
 India
India
-
 Indonesia
-
 Iran, Islamic republic
-
 Iraq
Iraq
-
 Ireland
-
 Israel
-
 Italy
Italy
-
 Jamaica
-
 Japan
Japan
-
 Jordan
-
 Kazakhstan
-
 Kenya
Kenya
-
 Korea
Korea
-
 Kuwait
-
 Kyrgyzstan
-
 Laos
Laos
-
 Latvia
-
 Lebanon
-
 Lesotho
-
 Libya
Libya
-
 Lithuania
-
 Luxembourg
-
 Madagascar
-
 Malaysia
-
 Malta
Malta
-
 Mauritius
-
 Mexico
-
 Moldova
-
 Mongolia
-
 Montenegro
-
 Morocco
-
 Mozambique
-
 Myanmar
-
 Namibia
-
 Nepal
Nepal
-
 Netherlands
-
 New Zealand
-
 Nigeria
-
 North Macedonia
-
 Norway
-
 Oman
Oman
-
 Pakistan
-
 Palestine
-
 Panama
-
 Papua New Guinea
-
 Paraguay
-
 Peru
Peru
-
 Philippines
-
 Poland
-
 Portugal
-
 Puerto Rico
-
 Qatar
Qatar
-
 Reunion
-
 Romania
-
 Rwanda
-
 Saudi Arabia
-
 Serbia
-
 Singapore
-
 Slovakia
-
 Slovenia
-
 Somalia
-
 South Africa
-
 Spain
Spain
-
 Sri Lanka
-
 Sweden
-
 Switzerland
-
 Syria
Syria
-
 Taiwan
-
 Tajikistan
-
 Tanzania
-
 Thailand
-
 Trinidad and Tobago
-
 Tunisia
-
 Turkey
-
 UAE
UAE
-
 Uganda
-
 Ukraine
-
 United Kingdom
-
United States
-
 Uruguay
-
 Uzbekistan
-
 Venezuela
-
 Vietnam
-
 Yemen
Yemen
-
 Zambia
-
 Zimbabwe
- Forex
- Crypto











