
Ethereum price prediction: Will wall of selling persist? ETH down 1.49%

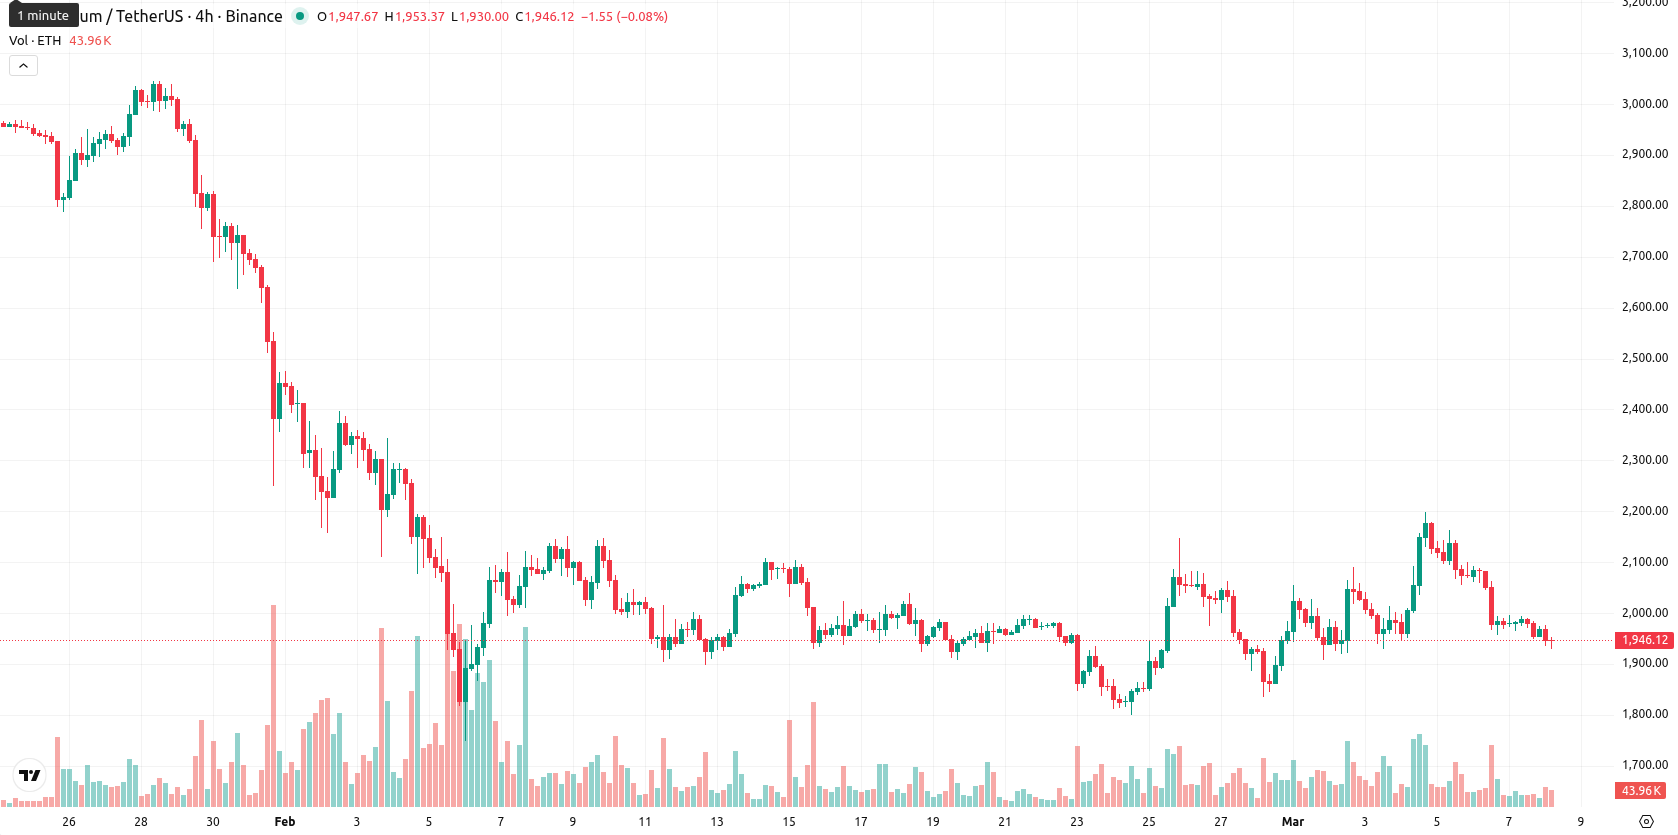
Ethereum (ETH) is trading at $1,944.12, marking a daily decline of 1.49%. The price remains below the MA-20 at $1,979.19, MA-50 at $2,302.08, and MA-200 at $3,336.52, highlighting persistent selling pressure. Immediate resistance is provided by the Ichimoku Kijun at $1,999.50.
Highlights
- Harvard's endowment shifted $86.8 million from Bitcoin ETFs into iShares Ethereum Trust, signaling institutional interest ahead of Ethereum upgrades.
- Significant outflows hit major Ethereum ETFs, while Culper Research disclosed a short position citing concerns over staking yields and validator stability.
- Ethereum faces sustained selling pressure, trading below key moving averages, with a projected range of $1,750 to $2,100 and bearish momentum dominating technical signals.
Institutional rotation and outflows as staking concerns intensify
On March 6, 2026, Harvard's endowment rotated $86.8 million from Bitcoin ETFs into the iShares Ethereum Trust, while large holders accumulated over 252,000 ETH in the lead-up to upcoming network upgrades. The 21Shares Ethereum ETF reported a $5.21 million outflow, representing about 27% of its assets, and the Bitwise Ethereum ETF recorded $3.58 million in outflows during the same period, accompanied by Culper Research disclosing a short position over concerns about staking yields and validator health. Pakistan introduced new licensing rules for crypto businesses under the Virtual Assets Act 2026. Cross-chain infrastructure connecting Ethereum to Binance Smart Chain and Solana also launched, expanding user access, though price action has remained under broader selling pressure.
Bearish momentum persists amid moderate volatility and oversold signals
Technically, momentum remains negative for ETH. The MACD is aligned with a strong sell bias, and the ADX points to a continuing bearish trend. The RSI stands at 44.08, which reflects underlying weakness but not oversold levels, while the Stochastic RSI and CCI indicate mainly neutral to slightly negative momentum. Bull/Bear Power remains deeply oversold, suggesting sellers dominate intraday activity. The session opened without significant gaps, but with the price now near the lower third of today’s range ($1,933.10 – $1,977.02), volatility has been moderate and pressure steady throughout the day.
Sideways-to-lower risk dominates absent breakout above resistance
In the near term, the volatility band is projected between $1,750 and $2,100 for the next five trading days. The probability of a price increase is assessed at less than 20%, with a sideways-to-lower continuation expected barring a technical breakout. A move above $2,000 – $2,100 would be required for a bullish scenario, while a drop below $1,750 is possible if negative momentum remains in force.
Last time, analysts noted that Ethereum is exhibiting persistent bearish momentum, with the asset trading below all major moving averages and momentum indicators, including MACD and ADX, signaling strong selling pressure and downside risk. Key resistance levels remain overhead, while RSI readings signal further vulnerability, and the probability of a near-term upside reversal is low barring a decisive recovery above immediate resistance.


Latest Ethereum News


-
 Afghanistan
-
 Albania
-
 Algeria
-
 Angola
-
 Argentina
-
 Armenia
-
 Australia
-
 Austria
-
 Azerbaijan
-
 Bahamas
-
 Bahrain
-
 Bangladesh
-
 Belarus
-
 Belgium
-
 Bolivia
-
 Botswana
-
 Brazil
-
 Brunei
-
 Bulgaria
-
 Cambodia
-
 Cameroon
-
 Canada
-
 Chile
Chile
-
 China
China
-
 Colombia
-
 Congo
Congo
-
 Costa Rica
-
 Cote d'Ivoire
-
 Croatia
-
 Cuba
Cuba
-
 Cyprus
-
 Czechia
-
 DR Congo
-
 Denmark
-
 Dominican Republic
-
 Ecuador
-
 Egypt
Egypt
-
 El Salvador
-
 Estonia
-
 Eswatini
-
 Ethiopia
-
 Finland
-
 France
-
 Georgia
-
 Germany
-
 Ghana
Ghana
-
 Greece
-
 Haiti
Haiti
-
 Hong Kong
-
 Hungary
-
 India
India
-
 Indonesia
-
 Iran, Islamic republic
-
 Iraq
Iraq
-
 Ireland
-
 Israel
-
 Italy
Italy
-
 Jamaica
-
 Japan
Japan
-
 Jordan
-
 Kazakhstan
-
 Kenya
Kenya
-
 Korea
Korea
-
 Kuwait
-
 Kyrgyzstan
-
 Laos
Laos
-
 Latvia
-
 Lebanon
-
 Lesotho
-
 Libya
Libya
-
 Lithuania
-
 Luxembourg
-
 Madagascar
-
 Malaysia
-
 Malta
Malta
-
 Mauritius
-
 Mexico
-
 Moldova
-
 Mongolia
-
 Montenegro
-
 Morocco
-
 Mozambique
-
 Myanmar
-
 Namibia
-
 Nepal
Nepal
-
 Netherlands
-
 New Zealand
-
 Nigeria
-
 North Macedonia
-
 Norway
-
 Oman
Oman
-
 Pakistan
-
 Palestine
-
 Panama
-
 Papua New Guinea
-
 Paraguay
-
 Peru
Peru
-
 Philippines
-
 Poland
-
 Portugal
-
 Puerto Rico
-
 Qatar
Qatar
-
 Reunion
-
 Romania
-
 Rwanda
-
 Saudi Arabia
-
 Serbia
-
 Singapore
-
 Slovakia
-
 Slovenia
-
 Somalia
-
 South Africa
-
 Spain
Spain
-
 Sri Lanka
-
 Sweden
-
 Switzerland
-
 Syria
Syria
-
 Taiwan
-
 Tajikistan
-
 Tanzania
-
 Thailand
-
 Trinidad and Tobago
-
 Tunisia
-
 Turkey
-
 UAE
UAE
-
 Uganda
-
 Ukraine
-
 United Kingdom
-
United States
-
 Uruguay
-
 Uzbekistan
-
 Venezuela
-
 Vietnam
-
 Yemen
Yemen
-
 Zambia
-
 Zimbabwe
- Forex
- Crypto
