
Flow: Legal moves and Asia push spark 43.55% rally despite long-term resistance

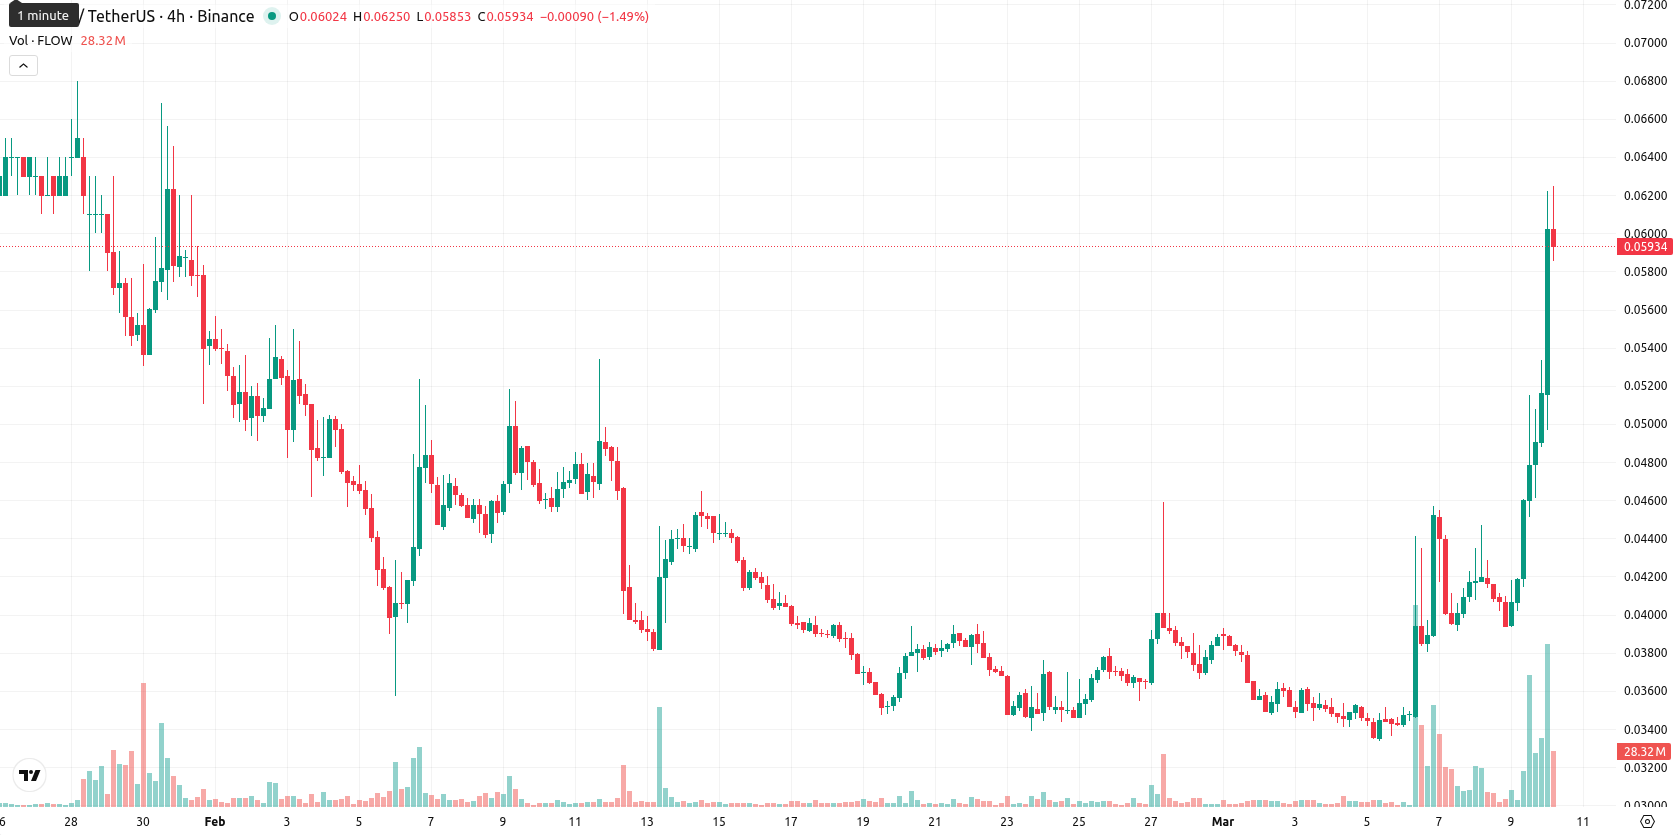
Flow (FLOW) is trading at $0.059, marking a sharp daily move up of 43.55%. The asset stands well above its MA-20 ($0.0379) and MA-50 ($0.0477), but remains significantly below the MA-200 ($0.2113), highlighting a strong short- and medium-term bullish trend while long-term resistance persists.
Highlights
- The Flow Foundation and Dapper Labs seek an injunction to stop South Korean exchanges from suspending FLOW trading despite no regulatory or financial action against the token.
- The foundation is expanding its Asian footprint via new exchange listings, improved self-custody support, and potential partnerships to boost regional activity.
- FLOW surged over 43% intraday on strong buying, yet overbought signals and technicals suggest consolidation within the $0.056–$0.062 range and downside risk.
Legal action and Asia focus as exchanges weigh FLOW trading suspensions
The Flow Foundation and Dapper Labs have filed an emergency injunction with the Seoul Central District Court to prevent South Korea's leading crypto exchanges from suspending FLOW trading. No regulatory body has taken action against FLOW, and no Korean exchanges reported financial loss from the December incident. The foundation is also increasing its presence in Asia, working towards more regional exchange listings and strengthening user support through expanded self-custody guidance and potential collaboration with Korbit.
Momentum dominance as mixed signals flag near-term caution
Technically, FLOW’s position above the MA-20 and MA-50 signals strong short- and medium-term buying momentum, though its inability to reclaim the MA-200 keeps longer-term bearish pressure in play. The immediate support now lies at the Ichimoku Kijun level of $0.0433. Key resistance is found within the recent $0.0501–$0.0622 band. Momentum signals are mixed: while the ADX confirms a strong trend and Bull/Bear Power shows buyer dominance, the MACD still indicates downside risk. The RSI is bullish but not overstretched, whereas the Stochastic RSI and CCI point to overbought territory. The Awesome Oscillator reinforces prevailing intraday bullishness. Overall, buyers remain in control but overbought oscillators flag short-term caution.
Range-bound trading likely as upside momentum faces resistance
Over the next five days, FLOW is likely to trade in a typical volatility band between $0.056 and $0.062, consolidating near current levels. The probability of further upward movement above $0.062 is low, while short-term declines are more likely based on weekly technical signals. Sustained gains require a decisive break above $0.062, but if support near $0.056 fails, additional downside may develop. Sideways movement within the stated price range is the baseline scenario for the immediate term.
Last time, analysts noted that FLOW exhibited short-term bullish momentum above its 20-day moving average, trading just below key medium-term resistance at the 50-day MA while remaining well below its long-term 200-day average. Despite today’s strong price advance, mixed technical indicators—including a bearish MACD, firm ADX, neutral RSI, and overbought oscillators—reflect diverging signals, suggesting persistent upward pressure but limited upside pending a clear break above immediate resistance.


Latest FLOW News


-
 Afghanistan
-
 Albania
-
 Algeria
-
 Angola
-
 Argentina
-
 Armenia
-
 Australia
-
 Austria
-
 Azerbaijan
-
 Bahamas
-
 Bahrain
-
 Bangladesh
-
 Belarus
-
 Belgium
-
 Bolivia
-
 Botswana
-
 Brazil
-
 Brunei
-
 Bulgaria
-
 Cambodia
-
 Cameroon
-
 Canada
-
 Chile
Chile
-
 China
China
-
 Colombia
-
 Congo
Congo
-
 Costa Rica
-
 Cote d'Ivoire
-
 Croatia
-
 Cuba
Cuba
-
 Cyprus
-
 Czechia
-
 DR Congo
-
 Denmark
-
 Dominican Republic
-
 Ecuador
-
 Egypt
Egypt
-
 El Salvador
-
 Estonia
-
 Eswatini
-
 Ethiopia
-
 Finland
-
 France
-
 Georgia
-
 Germany
-
 Ghana
Ghana
-
 Greece
-
 Haiti
Haiti
-
 Hong Kong
-
 Hungary
-
 India
India
-
 Indonesia
-
 Iran, Islamic republic
-
 Iraq
Iraq
-
 Ireland
-
 Israel
-
 Italy
Italy
-
 Jamaica
-
 Japan
Japan
-
 Jordan
-
 Kazakhstan
-
 Kenya
Kenya
-
 Korea
Korea
-
 Kuwait
-
 Kyrgyzstan
-
 Laos
Laos
-
 Latvia
-
 Lebanon
-
 Lesotho
-
 Libya
Libya
-
 Lithuania
-
 Luxembourg
-
 Madagascar
-
 Malaysia
-
 Malta
Malta
-
 Mauritius
-
 Mexico
-
 Moldova
-
 Mongolia
-
 Montenegro
-
 Morocco
-
 Mozambique
-
 Myanmar
-
 Namibia
-
 Nepal
Nepal
-
 Netherlands
-
 New Zealand
-
 Nigeria
-
 North Macedonia
-
 Norway
-
 Oman
Oman
-
 Pakistan
-
 Palestine
-
 Panama
-
 Papua New Guinea
-
 Paraguay
-
 Peru
Peru
-
 Philippines
-
 Poland
-
 Portugal
-
 Puerto Rico
-
 Qatar
Qatar
-
 Reunion
-
 Romania
-
 Rwanda
-
 Saudi Arabia
-
 Serbia
-
 Singapore
-
 Slovakia
-
 Slovenia
-
 Somalia
-
 South Africa
-
 Spain
Spain
-
 Sri Lanka
-
 Sweden
-
 Switzerland
-
 Syria
Syria
-
 Taiwan
-
 Tajikistan
-
 Tanzania
-
 Thailand
-
 Trinidad and Tobago
-
 Tunisia
-
 Turkey
-
 UAE
UAE
-
 Uganda
-
 Ukraine
-
 United Kingdom
-
United States
-
 Uruguay
-
 Uzbekistan
-
 Venezuela
-
 Vietnam
-
 Yemen
Yemen
-
 Zambia
-
 Zimbabwe
- Forex
- Crypto
