
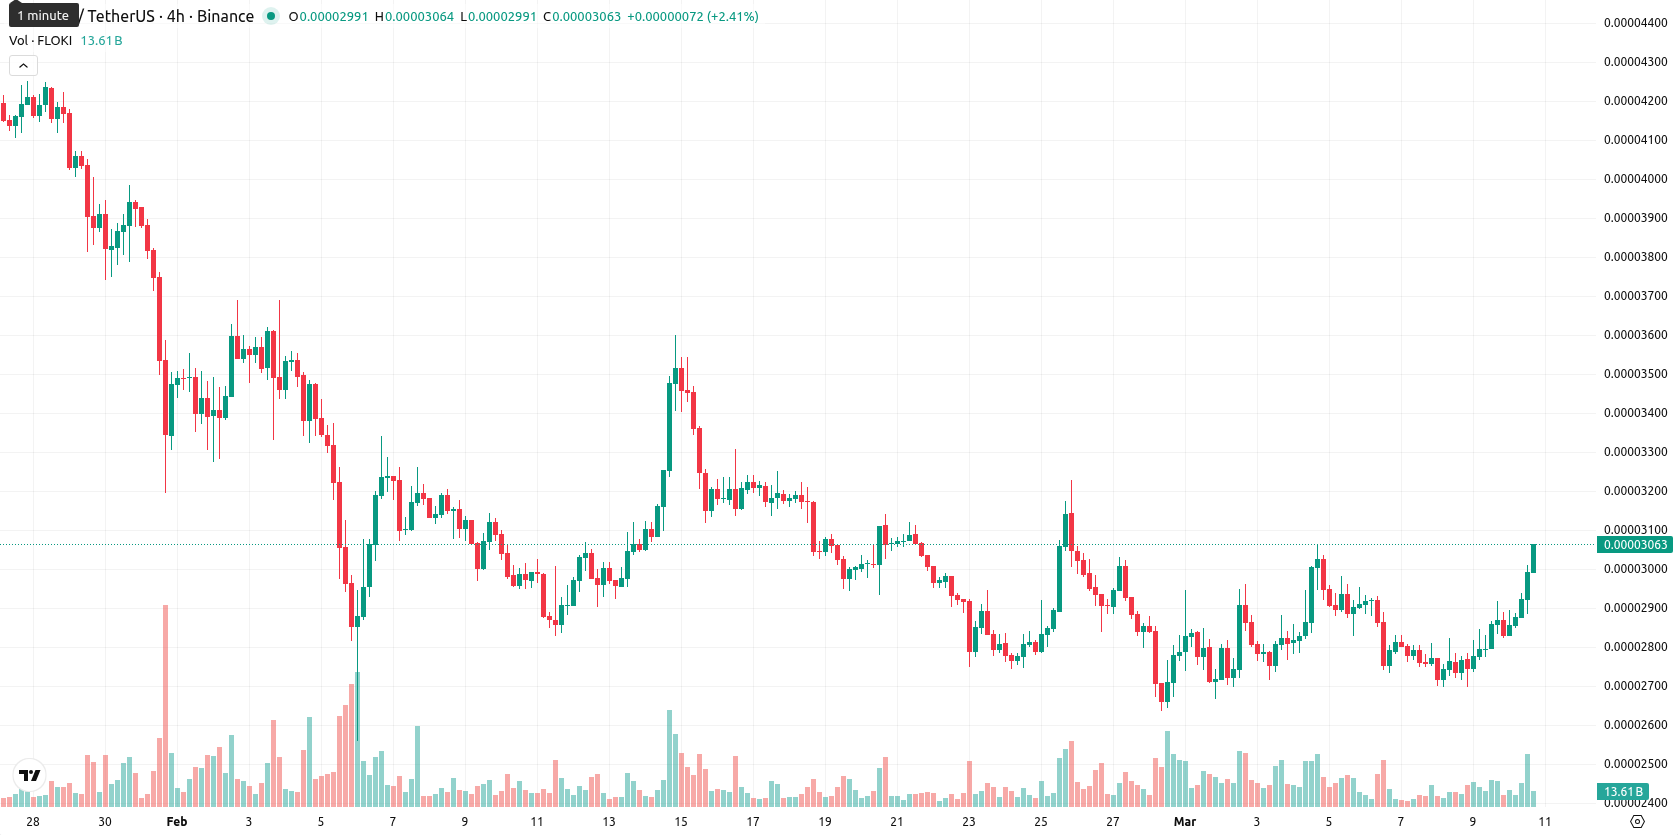
+7.05% for Floki Inu — Intraday volatility highlights buyer strength near resistance

Floki Inu (FLOKI) opens the session at $0.0000305, climbing 7.05% on the day. The price trades above the MA-20 ($0.00002879) but remains below the MA-50 ($0.00003319) and MA-200 ($0.00005897), signaling short-term bullish momentum amid medium- to long-term bearish trends.
Highlights
- FLOKI price shows short-term momentum but remains below key medium- and long-term trend indicators, signaling overall bearish pressure.
- Technical signals are mixed, with strong daily gains but persistent weekly sell signals and weak relative strength, suggesting limited upside.
- Expect near-term consolidation between $0.0000290 support and $0.0000326 resistance, with a break below support increasing downside risk.
Conflicting momentum as resistance levels cap price strength
On the technical front, FLOKI is showing positive short-term signals above the MA-20, but both the MA-50 and MA-200 remain overhead as strong resistance levels. The Ichimoku Kijun level is at $0.00003117, which acts as immediate resistance, while support is near $0.0000290. Momentum indicators are mixed: the daily MACD and ADX point to bearish pressure, but the Bull/Bear Power (BBP) indicator reveals buyer dominance for the session. Oscillators present conflicting signals, with RSI at 43 (weak), Stoch RSI in overbought condition above 80, and CCI neutral. Price trades near the upper end of today's range after a flat open, emphasizing intraday volatility and buying strength despite diverging daily momentum signals.
Sideways consolidation likely amid persistent weekly sell signals
For the week ahead, price action is expected to remain within a typical volatility band of $0.0000290 to $0.0000326 relative to current levels. The probability of significant upside movement remains low (under 20%) due to persistent weekly sell signals from the MACD, RSI, and the MA-50. FLOKI is likely to consolidate sideways, with upside potential requiring a decisive move above $0.0000312 resistance, while a bearish scenario would emerge if support at $0.0000290 is breached.
Previously it was reported that Floki Inu is trading well below its key moving averages, with a firmly bearish momentum confirmed by major indicators such as MACD, ADX, and RSI, and faces immediate resistance at the Ichimoku Kijun level. The asset is expected to consolidate within a defined range amid high volatility, as sustained downside pressure and limited bullish signals currently dominate the technical outlook.


Latest Floki News


-
 Afghanistan
-
 Albania
-
 Algeria
-
 Angola
-
 Argentina
-
 Armenia
-
 Australia
-
 Austria
-
 Azerbaijan
-
 Bahamas
-
 Bahrain
-
 Bangladesh
-
 Belarus
-
 Belgium
-
 Bolivia
-
 Botswana
-
 Brazil
-
 Brunei
-
 Bulgaria
-
 Cambodia
-
 Cameroon
-
 Canada
-
 Chile
Chile
-
 China
China
-
 Colombia
-
 Congo
Congo
-
 Costa Rica
-
 Cote d'Ivoire
-
 Croatia
-
 Cuba
Cuba
-
 Cyprus
-
 Czechia
-
 DR Congo
-
 Denmark
-
 Dominican Republic
-
 Ecuador
-
 Egypt
Egypt
-
 El Salvador
-
 Estonia
-
 Eswatini
-
 Ethiopia
-
 Finland
-
 France
-
 Georgia
-
 Germany
-
 Ghana
Ghana
-
 Greece
-
 Haiti
Haiti
-
 Hong Kong
-
 Hungary
-
 India
India
-
 Indonesia
-
 Iran, Islamic republic
-
 Iraq
Iraq
-
 Ireland
-
 Israel
-
 Italy
Italy
-
 Jamaica
-
 Japan
Japan
-
 Jordan
-
 Kazakhstan
-
 Kenya
Kenya
-
 Korea
Korea
-
 Kuwait
-
 Kyrgyzstan
-
 Laos
Laos
-
 Latvia
-
 Lebanon
-
 Lesotho
-
 Libya
Libya
-
 Lithuania
-
 Luxembourg
-
 Madagascar
-
 Malaysia
-
 Malta
Malta
-
 Mauritius
-
 Mexico
-
 Moldova
-
 Mongolia
-
 Montenegro
-
 Morocco
-
 Mozambique
-
 Myanmar
-
 Namibia
-
 Nepal
Nepal
-
 Netherlands
-
 New Zealand
-
 Nigeria
-
 North Macedonia
-
 Norway
-
 Oman
Oman
-
 Pakistan
-
 Palestine
-
 Panama
-
 Papua New Guinea
-
 Paraguay
-
 Peru
Peru
-
 Philippines
-
 Poland
-
 Portugal
-
 Puerto Rico
-
 Qatar
Qatar
-
 Reunion
-
 Romania
-
 Rwanda
-
 Saudi Arabia
-
 Serbia
-
 Singapore
-
 Slovakia
-
 Slovenia
-
 Somalia
-
 South Africa
-
 Spain
Spain
-
 Sri Lanka
-
 Sweden
-
 Switzerland
-
 Syria
Syria
-
 Taiwan
-
 Tajikistan
-
 Tanzania
-
 Thailand
-
 Trinidad and Tobago
-
 Tunisia
-
 Turkey
-
 UAE
UAE
-
 Uganda
-
 Ukraine
-
 United Kingdom
-
United States
-
 Uruguay
-
 Uzbekistan
-
 Venezuela
-
 Vietnam
-
 Yemen
Yemen
-
 Zambia
-
 Zimbabwe
- Forex
- Crypto
