
Bitcoin price prediction: More losses ahead despite ETF inflows? BTC slips below key resistance

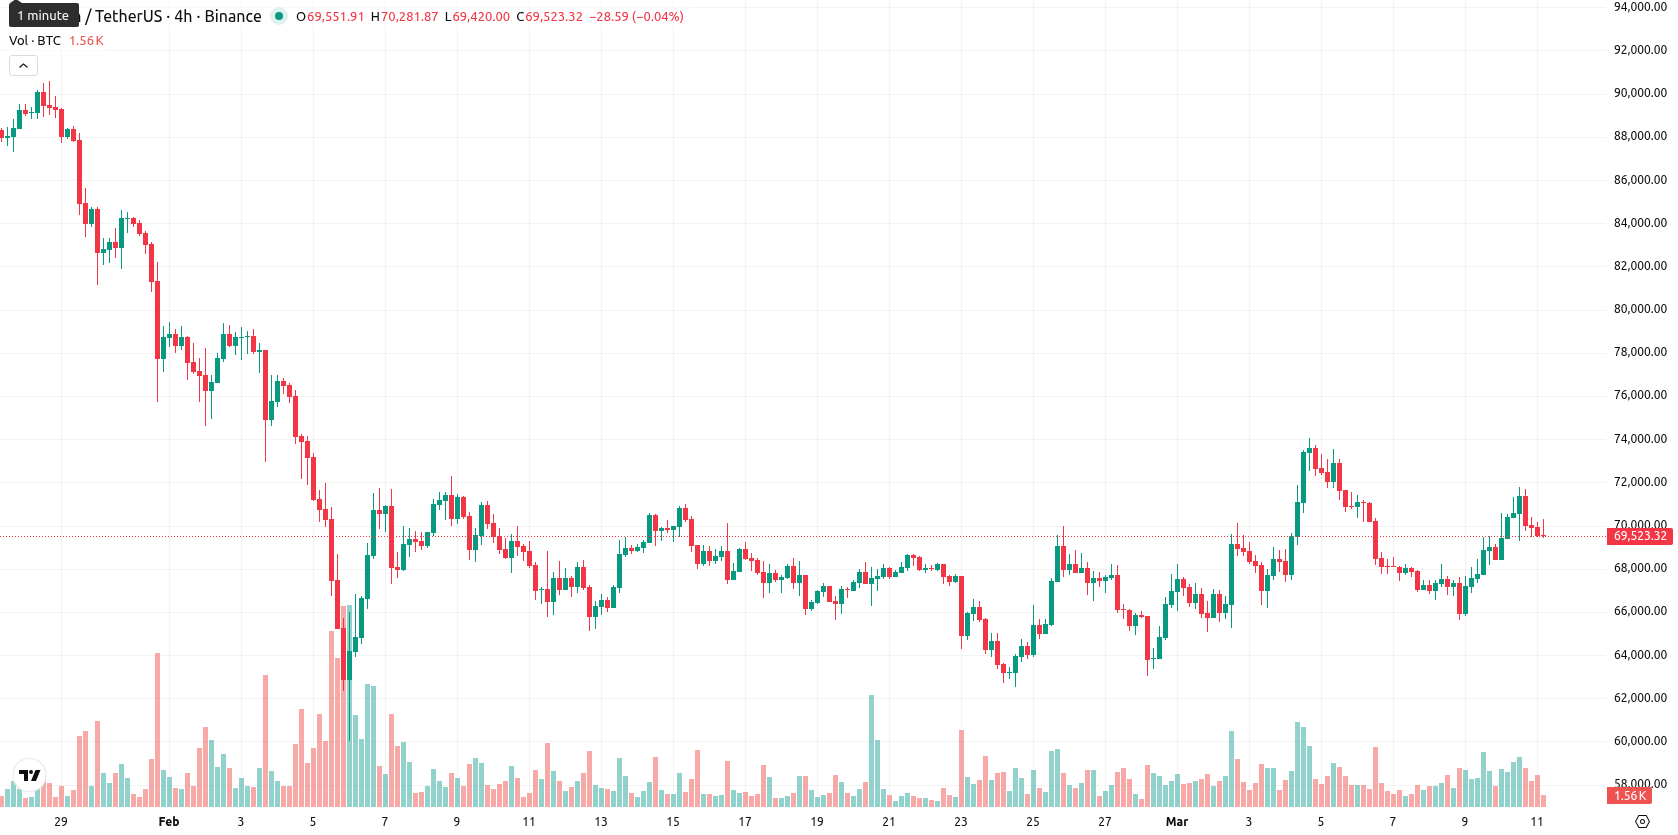
Bitcoin (BTC) is trading at $69,510.37 after slipping 0.66% on the session. The asset remains above both the SMA-20 ($67,688.67) and the Ichimoku Kijun level ($68,280.14), but continues to trade below the SMA-50 ($73,234.27) and SMA-200 ($94,980.91), highlighting a short-term bullish bias amid ongoing medium- and long-term downside pressure.
Highlights
- U.S.-listed spot Bitcoin ETFs saw $167.1 million in inflows Monday, reversing an outflow streak and lifting total net inflows above $10 billion.
- Institutional investors, led by BlackRock and Fidelity, continue accumulating Bitcoin, with one fund now holding approximately 738,731 BTC.
- BTC trades with short-term bullish momentum but faces persistent medium- and long-term bearish pressure, with a 5-day projected range of $62,000–$75,000 and downside risk dominant.
Institutional accumulation absorbs selling as ETF inflows surge
U.S.-listed spot Bitcoin ETFs recorded inflows of $167.1 million on Monday and $167.03 million on March 9, 2025, reversing a brief streak of outflows and bringing total net inflows for these products to over $10 billion since inception. BlackRock's IBIT and Fidelity's FBTC were the primary contributors to these inflows. Strategy made a new acquisition of 17,994 BTC, raising its total holdings to approximately 738,731 BTC. These developments were accompanied by renewed institutional participation and corporate accumulation, though price action has remained under broader selling pressure.
Bullish short-term bias challenged by mixed momentum and resistance
BTC is currently above both the SMA-20 ($67,688.67) and the Ichimoku Kijun ($68,280.14), but trading below the SMA-50 ($73,234.27) and SMA-200 ($94,980.91). This placement suggests a short-term bullish bias, while medium- and long-term outlooks show ongoing downside pressure from sellers. The Kijun level at $68,280.14 is acting as immediate resistance for the current session. Momentum readings indicate generally bearish conditions on the daily timeframe, with the MACD signaling a strong sell and the ADX at 35.43, confirming a robust prevailing trend. RSI remains neutral to slightly bullish (50.81), while the Stoch RSI is also neutral; CCI suggests overbought conditions and BBP is heavily positive, highlighting continued buyer dominance intraday. Despite some bullish undertones from the BBP and short-term price structure, the Awesome Oscillator gives a neutral signal. Today’s price action shows BTC slipping 0.66% from the previous session, without a meaningful gap between the previous close and today’s open, with price now near the low of today’s range; volatility has been moderate and the intraday tone reflects pressure after the open. Momentum and oscillators are giving mixed signals, revealing a clear divergence between short-term buying interest and persistent bearish momentum on higher timeframes.
Downside risk increases as indicators favor continued corrective move
Looking ahead, the expected price range for the next 5 trading days is approximately $62,000 to $75,000, adjusted in line with recent volatility and current levels. The probability of a price increase is very low (less than 20%), making a further decline more likely given persistent bearish signals from the weekly MA-50, RSI, ADX, and MACD. The baseline scenario sees BTC moving within a wide sideways corridor, while a bullish breakout above immediate resistance could trigger a retest of the $75,000 area. Conversely, a bearish break below support may push prices toward the $62,000 — $64,000 zone.
Previously it was reported that Bitcoin is trading below its recent all-time high, with analysts observing a cautious trend as price action remains consolidative. Technical indicators highlight potential for further downside toward key support levels, while momentum and macroeconomic factors such as central bank policy and equity markets continue to guide sentiment.


-
 Afghanistan
-
 Albania
-
 Algeria
-
 Angola
-
 Argentina
-
 Armenia
-
 Australia
-
 Austria
-
 Azerbaijan
-
 Bahamas
-
 Bahrain
-
 Bangladesh
-
 Belarus
-
 Belgium
-
 Bolivia
-
 Botswana
-
 Brazil
-
 Brunei
-
 Bulgaria
-
 Cambodia
-
 Cameroon
-
 Canada
-
 Chile
Chile
-
 China
China
-
 Colombia
-
 Congo
Congo
-
 Costa Rica
-
 Cote d'Ivoire
-
 Croatia
-
 Cuba
Cuba
-
 Cyprus
-
 Czechia
-
 DR Congo
-
 Denmark
-
 Dominican Republic
-
 Ecuador
-
 Egypt
Egypt
-
 El Salvador
-
 Estonia
-
 Eswatini
-
 Ethiopia
-
 Finland
-
 France
-
 Georgia
-
 Germany
-
 Ghana
Ghana
-
 Greece
-
 Haiti
Haiti
-
 Hong Kong
-
 Hungary
-
 India
India
-
 Indonesia
-
 Iran, Islamic republic
-
 Iraq
Iraq
-
 Ireland
-
 Israel
-
 Italy
Italy
-
 Jamaica
-
 Japan
Japan
-
 Jordan
-
 Kazakhstan
-
 Kenya
Kenya
-
 Korea
Korea
-
 Kuwait
-
 Kyrgyzstan
-
 Laos
Laos
-
 Latvia
-
 Lebanon
-
 Lesotho
-
 Libya
Libya
-
 Lithuania
-
 Luxembourg
-
 Madagascar
-
 Malaysia
-
 Malta
Malta
-
 Mauritius
-
 Mexico
-
 Moldova
-
 Mongolia
-
 Montenegro
-
 Morocco
-
 Mozambique
-
 Myanmar
-
 Namibia
-
 Nepal
Nepal
-
 Netherlands
-
 New Zealand
-
 Nigeria
-
 North Macedonia
-
 Norway
-
 Oman
Oman
-
 Pakistan
-
 Palestine
-
 Panama
-
 Papua New Guinea
-
 Paraguay
-
 Peru
Peru
-
 Philippines
-
 Poland
-
 Portugal
-
 Puerto Rico
-
 Qatar
Qatar
-
 Reunion
-
 Romania
-
 Rwanda
-
 Saudi Arabia
-
 Serbia
-
 Singapore
-
 Slovakia
-
 Slovenia
-
 Somalia
-
 South Africa
-
 Spain
Spain
-
 Sri Lanka
-
 Sweden
-
 Switzerland
-
 Syria
Syria
-
 Taiwan
-
 Tajikistan
-
 Tanzania
-
 Thailand
-
 Trinidad and Tobago
-
 Tunisia
-
 Turkey
-
 UAE
UAE
-
 Uganda
-
 Ukraine
-
 United Kingdom
-
United States
-
 Uruguay
-
 Uzbekistan
-
 Venezuela
-
 Vietnam
-
 Yemen
Yemen
-
 Zambia
-
 Zimbabwe
- Forex
- Crypto
