

Ethereum price prediction: Can ETF flows drive a breakout? ETH climbs to $2,109.89

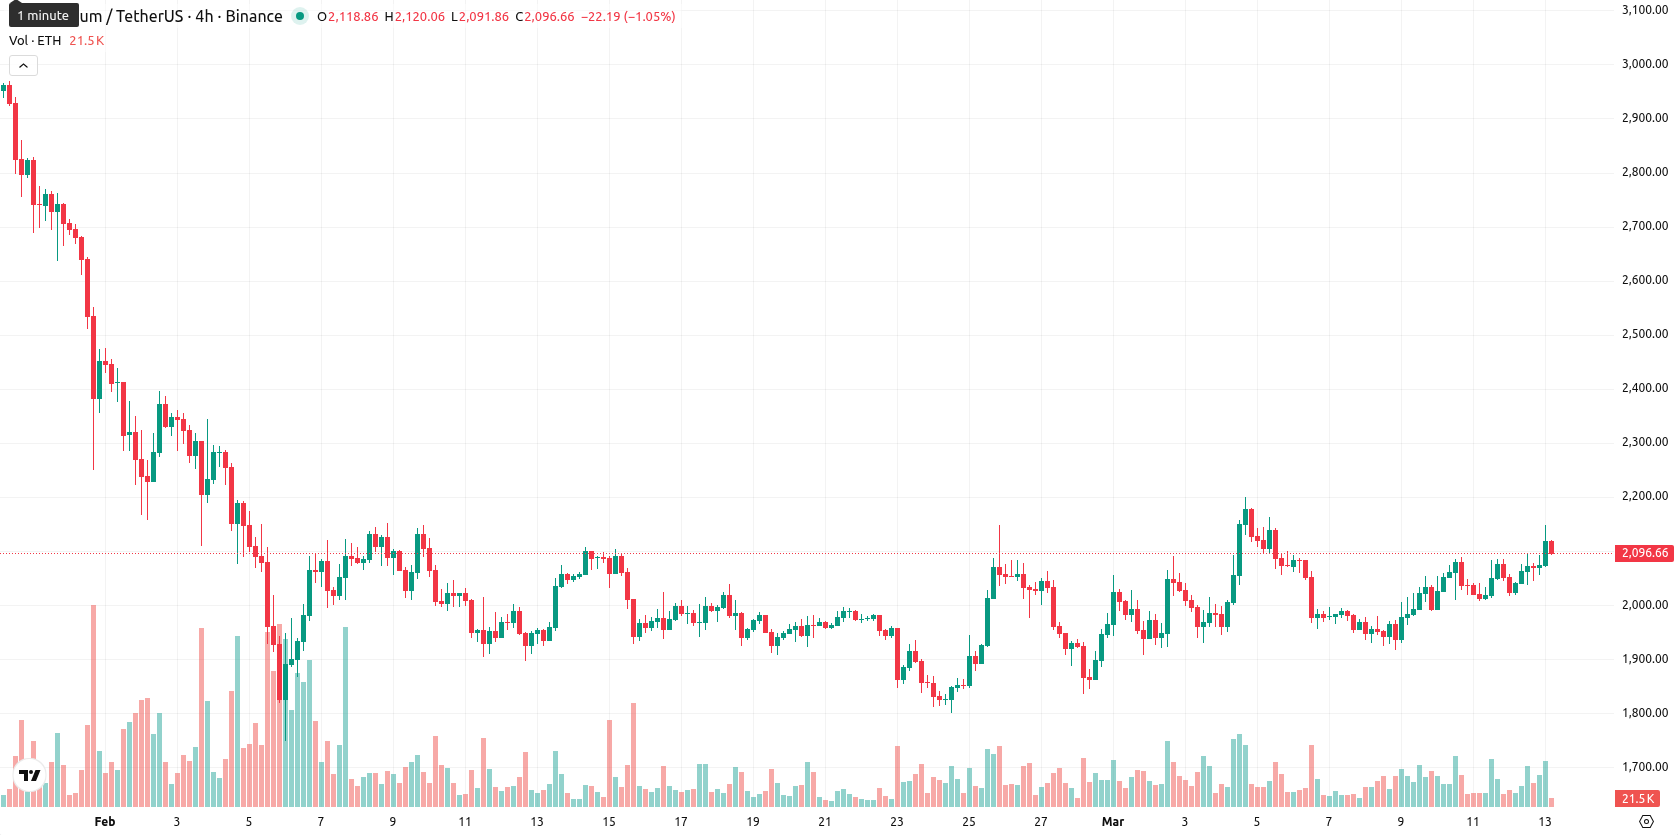
Ethereum (ETH) is trading at $2,109.89, up 3.98% for the day. The current price is positioned above its SMA-20 ($1,990.89), but below both the SMA-50 ($2,189.91) and SMA-200 ($3,272.25), indicating short-term strength with lingering medium- and long-term resistance.
 2538.52
2699.80
2538.52
2699.80
Highlights
- BlackRock launched the iShares Staked Ethereum Trust ETF (ETHB) on Nasdaq, debuting with $15.5 million in trading volume.
- Spot Ethereum ETFs saw $57 million in net inflows on March 11, reinforcing institutional ETH demand despite increased address phishing scams post-upgrade.
- Ethereum trades in a high-volatility range of $1,900–$2,170, with technicals suggesting more downside and likely near-term consolidation.
ETF inflows and scams rise as upgrades reshape Ethereum landscape
BlackRock has launched the iShares Staked Ethereum Trust ETF (ETHB) on Nasdaq, providing investors access to Ethereum exposure with staking rewards, and the ETF recorded approximately $15.5 million in trading volume on its debut. Spot Ethereum ETFs registered net inflows of around $57 million on March 11, reflecting continued institutional demand for ETH investment products. At the same time, Etherscan reported a spike in 'address poisoning' scams affecting Ethereum users after the Fusaka upgrade, while Vitalik Buterin noted that the PeerDAS network upgrade has increased the platform's data capacity.
Bullish intraday action faces overbought risks on mixed momentum
Technically, ETH finds immediate support at the Ichimoku Kijun level of $1,999.50. Momentum readings are mixed: while the D1 MACD and ADX continue to flag bearish pressure, today's strong move higher is confirmed by a gain of $80.83 and readings in buy territory from RSI (51.65), CCI (99.87), and the Awesome Oscillator. However, Stoch RSI and Bull/Bear Power indicate overbought conditions amid high volatility, as ETH trades near the upper end of the day's range ($2,071.09 – $2,148.45). This blend of overbought oscillators and bullish intraday action introduces a risk of short-term pullback even as buying currently dominates.
Sideways consolidation likely as breakout odds remain subdued
Over the next five sessions, ETH is expected to stay within a typical volatility band of $1,900 – $2,170. Current signals suggest a low probability (less than 20%) of a sustained upward breakout, with the most likely scenario being sideways consolidation between support at $1,900 and resistance at $2,170. A decisive move above $2,170 would require renewed and sustained demand, while a drop below $1,900 could trigger further declines given prevailing medium- and long-term bearish momentum.
Previously it was reported that Ethereum is showing a short-term bullish bias, trading above key near-term support levels and its 20-day moving average, yet remains below its 50- and 200-day moving averages, reflecting persistent medium- and long-term pressure. Technical indicators are mixed, with oscillators flashing buy signals and overbought conditions, while MACD suggests lingering negative momentum, limiting upside potential and supporting a consolidative outlook between established support and resistance levels amid elevated volatility.











-
 Afghanistan
-
 Albania
-
 Algeria
-
 Angola
-
 Argentina
-
 Armenia
-
 Australia
-
 Austria
-
 Azerbaijan
-
 Bahamas
-
 Bahrain
-
 Bangladesh
-
 Belarus
-
 Belgium
-
 Bolivia
-
 Botswana
-
 Brazil
-
 Brunei
-
 Bulgaria
-
 Cambodia
-
 Cameroon
-
 Canada
-
 Chile
Chile
-
 China
China
-
 Colombia
-
 Congo
Congo
-
 Costa Rica
-
 Cote d'Ivoire
-
 Croatia
-
 Cuba
Cuba
-
 Cyprus
-
 Czechia
-
 DR Congo
-
 Denmark
-
 Dominican Republic
-
 Ecuador
-
 Egypt
Egypt
-
 El Salvador
-
 Estonia
-
 Eswatini
-
 Ethiopia
-
 Finland
-
 France
-
 Georgia
-
 Germany
-
 Ghana
Ghana
-
 Greece
-
 Haiti
Haiti
-
 Hong Kong
-
 Hungary
-
 India
India
-
 Indonesia
-
 Iran, Islamic republic
-
 Iraq
Iraq
-
 Ireland
-
 Israel
-
 Italy
Italy
-
 Jamaica
-
 Japan
Japan
-
 Jordan
-
 Kazakhstan
-
 Kenya
Kenya
-
 Korea
Korea
-
 Kuwait
-
 Kyrgyzstan
-
 Laos
Laos
-
 Latvia
-
 Lebanon
-
 Lesotho
-
 Libya
Libya
-
 Lithuania
-
 Luxembourg
-
 Madagascar
-
 Malaysia
-
 Malta
Malta
-
 Mauritius
-
 Mexico
-
 Moldova
-
 Mongolia
-
 Montenegro
-
 Morocco
-
 Mozambique
-
 Myanmar
-
 Namibia
-
 Nepal
Nepal
-
 Netherlands
-
 New Zealand
-
 Nigeria
-
 North Macedonia
-
 Norway
-
 Oman
Oman
-
 Pakistan
-
 Palestine
-
 Panama
-
 Papua New Guinea
-
 Paraguay
-
 Peru
Peru
-
 Philippines
-
 Poland
-
 Portugal
-
 Puerto Rico
-
 Qatar
Qatar
-
 Reunion
-
 Romania
-
 Rwanda
-
 Saudi Arabia
-
 Serbia
-
 Singapore
-
 Slovakia
-
 Slovenia
-
 Somalia
-
 South Africa
-
 Spain
Spain
-
 Sri Lanka
-
 Sweden
-
 Switzerland
-
 Syria
Syria
-
 Taiwan
-
 Tajikistan
-
 Tanzania
-
 Thailand
-
 Trinidad and Tobago
-
 Tunisia
-
 Turkey
-
 UAE
UAE
-
 Uganda
-
 Ukraine
-
 United Kingdom
-
United States
-
 Uruguay
-
 Uzbekistan
-
 Venezuela
-
 Vietnam
-
 Yemen
Yemen
-
 Zambia
-
 Zimbabwe
- Forex
- Crypto












