
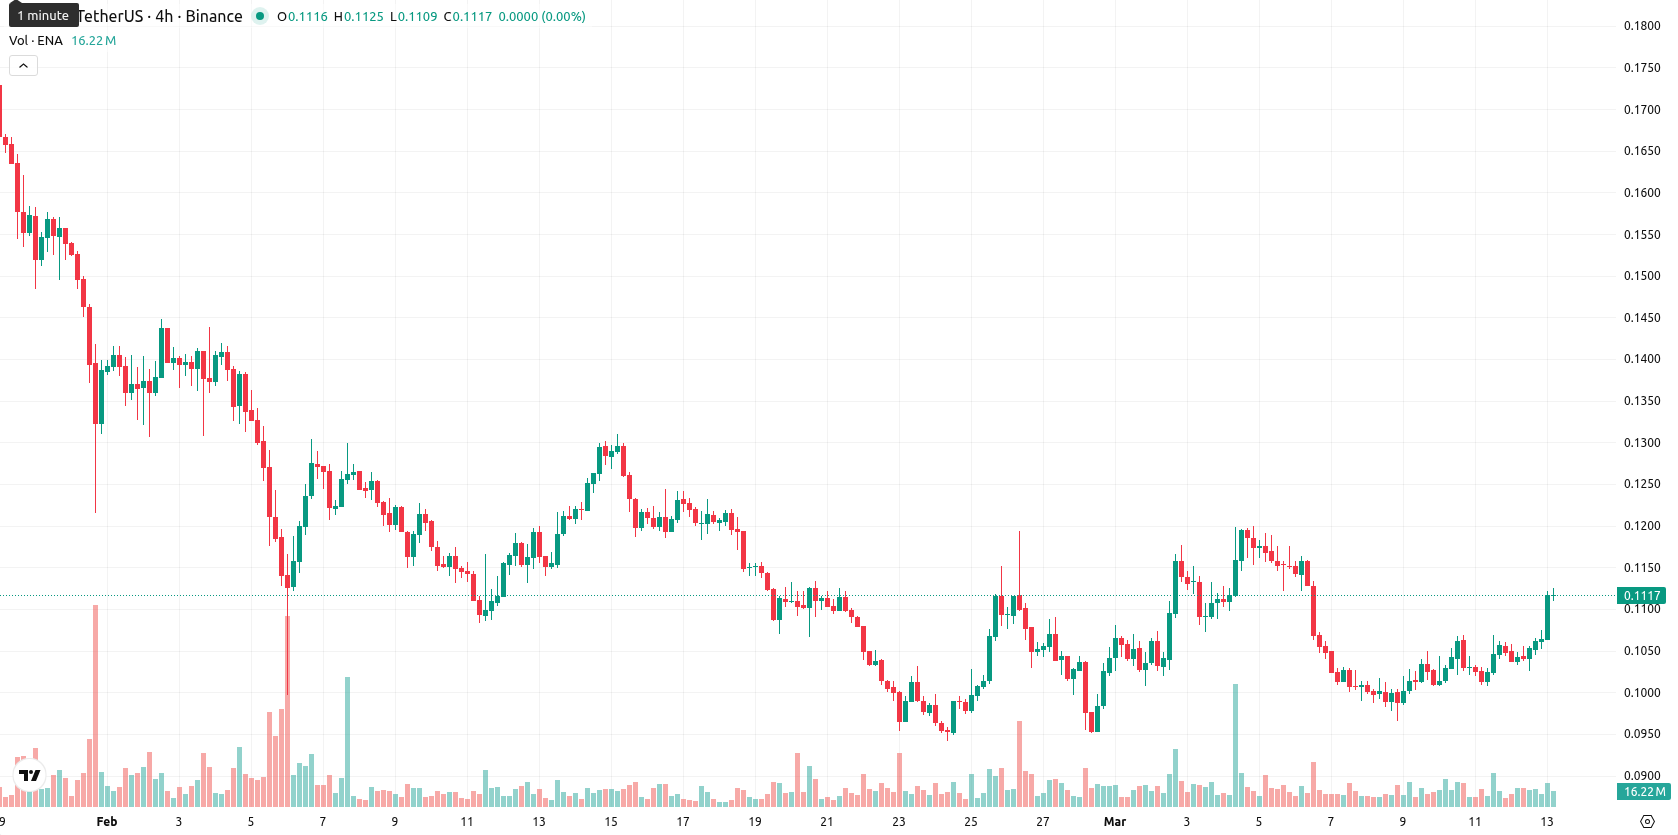
+7.03% for Ethena — Mixed technical signals with critical resistance near $0.113

Ethena (ENA) is trading at $0.1111 after a 7.03% daily gain, sitting above the MA-20 ($0.1053) yet below the MA-50 ($0.1243) and MA-200 ($0.3344), which highlights short-term relative strength against ongoing medium- and long-term downward pressure. The Ichimoku Kijun level on the daily chart stands at $0.1126, acting as immediate resistance.
Highlights
- Ethena’s synthetic dollar protocol capital has plunged over 85% to $791 million, reflecting major deleveraging amid shifting sentiment.
- Despite the contraction, traders in India can still access the Ethena token on Bitget with immediate crediting and a low entry threshold.
- Technical signals point to dominant short-term buying but a weak broader trend, with price likely to trade sideways between $0.100 and $0.120 over the next week.
Leverage exit drives capital outflow as sentiment shifts against ENA
Ethena’s synthetic dollar protocol experienced a substantial decline in deployed capital, dropping to $791 million — an over 85% contraction from its all-time high, indicating a sharp reduction in both long and short leverage positions as market sentiment shifts. Despite this contraction in positioning, Ethena token remains accessible for purchase on the Bitget exchange in India, with instant crediting and a $5 minimum order.
Mixed momentum persists as key signals diverge near resistance
Technical signals for ENA are mixed: while price action shows a 7.03% rise intraday with levels near today’s high and high volatility, MACD indicates a strong sell and ADX confirms a clear downtrend. BBP highlights strong intraday buyer dominance, yet RSI at 44.5, CCI near neutral, and Stoch RSI at 70 point to the lack of extreme conditions, with the Awesome Oscillator neutral and W1 RSI moderately oversold. The price is still below the MA-50 and MA-200, with immediate resistance at the Ichimoku Kijun ($0.1126) and key support at $0.100.
Modest recovery unlikely as downside bias dominates short-term forecast
Across the next five trading days, ENA is likely to oscillate within a typical volatility band between $0.100 and $0.120. Trend indicators from the weekly timeframe suggest the probability of a further rise is low (less than 20%), making a downside move more likely. Sideways action is the baseline scenario, but a sustained break above $0.113 would open the path to higher resistance, while a failure of $0.100 could trigger additional downside.
Previously it was reported that Ethena (ENA) is trading well below its key moving averages, reinforcing sustained bearish momentum across short-, medium-, and long-term trends, with intraday volatility elevating downside risk. Momentum indicators including MACD, ADX, and oscillators confirm a dominant bearish bias, while resistance is seen at $0.1126 and the lack of major support near current levels leaves the asset vulnerable to further declines.


Latest Ethena News


-
 Afghanistan
-
 Albania
-
 Algeria
-
 Angola
-
 Argentina
-
 Armenia
-
 Australia
-
 Austria
-
 Azerbaijan
-
 Bahamas
-
 Bahrain
-
 Bangladesh
-
 Belarus
-
 Belgium
-
 Bolivia
-
 Botswana
-
 Brazil
-
 Brunei
-
 Bulgaria
-
 Cambodia
-
 Cameroon
-
 Canada
-
 Chile
Chile
-
 China
China
-
 Colombia
-
 Congo
Congo
-
 Costa Rica
-
 Cote d'Ivoire
-
 Croatia
-
 Cuba
Cuba
-
 Cyprus
-
 Czechia
-
 DR Congo
-
 Denmark
-
 Dominican Republic
-
 Ecuador
-
 Egypt
Egypt
-
 El Salvador
-
 Estonia
-
 Eswatini
-
 Ethiopia
-
 Finland
-
 France
-
 Georgia
-
 Germany
-
 Ghana
Ghana
-
 Greece
-
 Haiti
Haiti
-
 Hong Kong
-
 Hungary
-
 India
India
-
 Indonesia
-
 Iran, Islamic republic
-
 Iraq
Iraq
-
 Ireland
-
 Israel
-
 Italy
Italy
-
 Jamaica
-
 Japan
Japan
-
 Jordan
-
 Kazakhstan
-
 Kenya
Kenya
-
 Korea
Korea
-
 Kuwait
-
 Kyrgyzstan
-
 Laos
Laos
-
 Latvia
-
 Lebanon
-
 Lesotho
-
 Libya
Libya
-
 Lithuania
-
 Luxembourg
-
 Madagascar
-
 Malaysia
-
 Malta
Malta
-
 Mauritius
-
 Mexico
-
 Moldova
-
 Mongolia
-
 Montenegro
-
 Morocco
-
 Mozambique
-
 Myanmar
-
 Namibia
-
 Nepal
Nepal
-
 Netherlands
-
 New Zealand
-
 Nigeria
-
 North Macedonia
-
 Norway
-
 Oman
Oman
-
 Pakistan
-
 Palestine
-
 Panama
-
 Papua New Guinea
-
 Paraguay
-
 Peru
Peru
-
 Philippines
-
 Poland
-
 Portugal
-
 Puerto Rico
-
 Qatar
Qatar
-
 Reunion
-
 Romania
-
 Rwanda
-
 Saudi Arabia
-
 Serbia
-
 Singapore
-
 Slovakia
-
 Slovenia
-
 Somalia
-
 South Africa
-
 Spain
Spain
-
 Sri Lanka
-
 Sweden
-
 Switzerland
-
 Syria
Syria
-
 Taiwan
-
 Tajikistan
-
 Tanzania
-
 Thailand
-
 Trinidad and Tobago
-
 Tunisia
-
 Turkey
-
 UAE
UAE
-
 Uganda
-
 Ukraine
-
 United Kingdom
-
United States
-
 Uruguay
-
 Uzbekistan
-
 Venezuela
-
 Vietnam
-
 Yemen
Yemen
-
 Zambia
-
 Zimbabwe
- Forex
- Crypto
